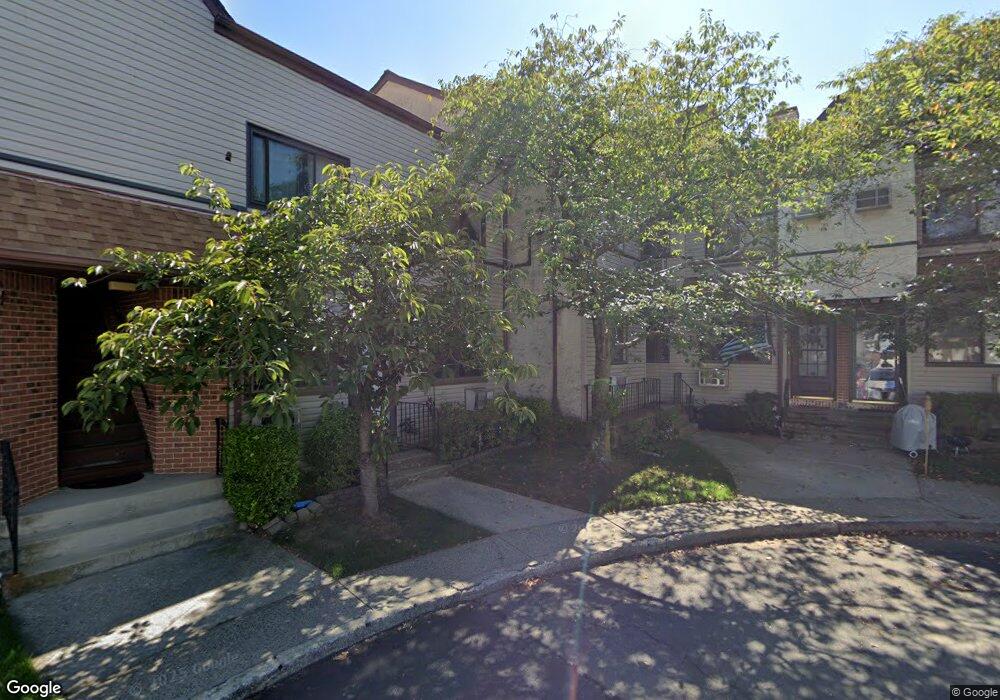
360 Barlow Ave Unit B4 Staten Island, NY 10308
Great Kills NeighborhoodEstimated Value: $428,000 - $492,000
2
Beds
2
Baths
972
Sq Ft
$477/Sq Ft
Est. Value
About This Home
This home is located at 360 Barlow Ave Unit B4, Staten Island, NY 10308 and is currently estimated at $463,568, approximately $476 per square foot. 360 Barlow Ave Unit B4 is a home located in Richmond County with nearby schools including P.S. 32 The Gifford School, I.S. 075 Frank D. Paulo, and Susan E Wagner High School.
Ownership History
Date
Name
Owned For
Owner Type
Purchase Details
Closed on
Jan 17, 2019
Sold by
Debeau Alexandre L and Dubeau Isabelle M
Bought by
Moore John and Moore Lori
Current Estimated Value
Home Financials for this Owner
Home Financials are based on the most recent Mortgage that was taken out on this home.
Original Mortgage
$252,000
Outstanding Balance
$221,559
Interest Rate
4.6%
Mortgage Type
New Conventional
Estimated Equity
$242,009
Purchase Details
Closed on
Mar 13, 2001
Sold by
Perillo Penelope
Bought by
Dubeau Alexandre L and Dubeau Isabelle M
Home Financials for this Owner
Home Financials are based on the most recent Mortgage that was taken out on this home.
Original Mortgage
$86,000
Interest Rate
6.97%
Purchase Details
Closed on
Sep 23, 1998
Sold by
Maloney Lisa K
Bought by
Perillo Penelope
Purchase Details
Closed on
May 15, 1997
Sold by
Maloney Lisa K and Otoole Laura J
Bought by
Maloney Lisa K
Create a Home Valuation Report for This Property
The Home Valuation Report is an in-depth analysis detailing your home's value as well as a comparison with similar homes in the area
Home Values in the Area
Average Home Value in this Area
Purchase History
| Date | Buyer | Sale Price | Title Company |
|---|---|---|---|
| Moore John | $315,000 | First American Mortgage Solu | |
| Dubeau Alexandre L | $131,000 | First American Title Ins Co | |
| Perillo Penelope | $89,000 | Prestige Title Agency | |
| Maloney Lisa K | $75,000 | Ticor Title Guarantee Compan |
Source: Public Records
Mortgage History
| Date | Status | Borrower | Loan Amount |
|---|---|---|---|
| Open | Moore John | $252,000 | |
| Previous Owner | Dubeau Alexandre L | $86,000 |
Source: Public Records
Tax History Compared to Growth
Tax History
| Year | Tax Paid | Tax Assessment Tax Assessment Total Assessment is a certain percentage of the fair market value that is determined by local assessors to be the total taxable value of land and additions on the property. | Land | Improvement |
|---|---|---|---|---|
| 2025 | $3,314 | $24,535 | $1,510 | $23,025 |
| 2024 | $3,314 | $23,729 | $1,561 | $22,168 |
| 2023 | $3,231 | $15,908 | $1,497 | $14,411 |
| 2022 | $2,996 | $21,232 | $2,245 | $18,987 |
| 2021 | $2,980 | $19,706 | $2,245 | $17,461 |
| 2020 | $2,910 | $19,799 | $2,245 | $17,554 |
| 2019 | $2,876 | $17,216 | $2,245 | $14,971 |
| 2018 | $2,702 | $13,257 | $1,785 | $11,472 |
| 2017 | $2,550 | $12,507 | $1,828 | $10,679 |
| 2016 | $2,359 | $11,800 | $1,824 | $9,976 |
| 2015 | $2,199 | $11,457 | $1,718 | $9,739 |
| 2014 | $2,199 | $11,457 | $2,063 | $9,394 |
Source: Public Records
Map
Nearby Homes
- 360 Barlow Ave Unit 32
- 360 Barlow Ave Unit 12
- 339 Abingdon Ave
- 919 Armstrong Ave
- 969 Armstrong Ave
- 234 Brookfield Ave
- 37 E Stroud Ave
- 74 E Brandis Ave
- 248 Abingdon Ave
- 147 Cortelyou Ave Unit 2-3
- 510 Leverett Ave
- 223 Abingdon Ave
- 1069 Armstrong Ave
- 379 Brookfield Ave
- 88 Cortelyou Ave
- 538 Leverett Ave
- 57 Middle Loop Rd
- 400 Brookfield Ave
- 63 Genesee Ave
- 271 Doane Ave
- 360 Barlow Ave Unit 17
- 360 Barlow Ave Unit 30
- 360 Barlow Ave Unit 24
- 360 Barlow Ave Unit B2
- 360 Barlow Ave Unit B6
- 360 Barlow Ave Unit B8
- 360 Barlow Ave Unit B1
- 360 Barlow Ave Unit B3
- 360 Barlow Ave Unit B7
- 360 Barlow Ave Unit 28
- 360 Barlow Ave Unit 26
- 360 Barlow Ave Unit 34
- 360 Barlow Ave Unit 36
- 360 Barlow Ave Unit 38
- 360 Barlow Ave Unit 30
- 360 Barlow Ave Unit 33
- 360 Barlow Ave Unit 31
- 360 Barlow Ave Unit 29
- 360 Barlow Ave Unit 27
- 360 Barlow Ave Unit 25