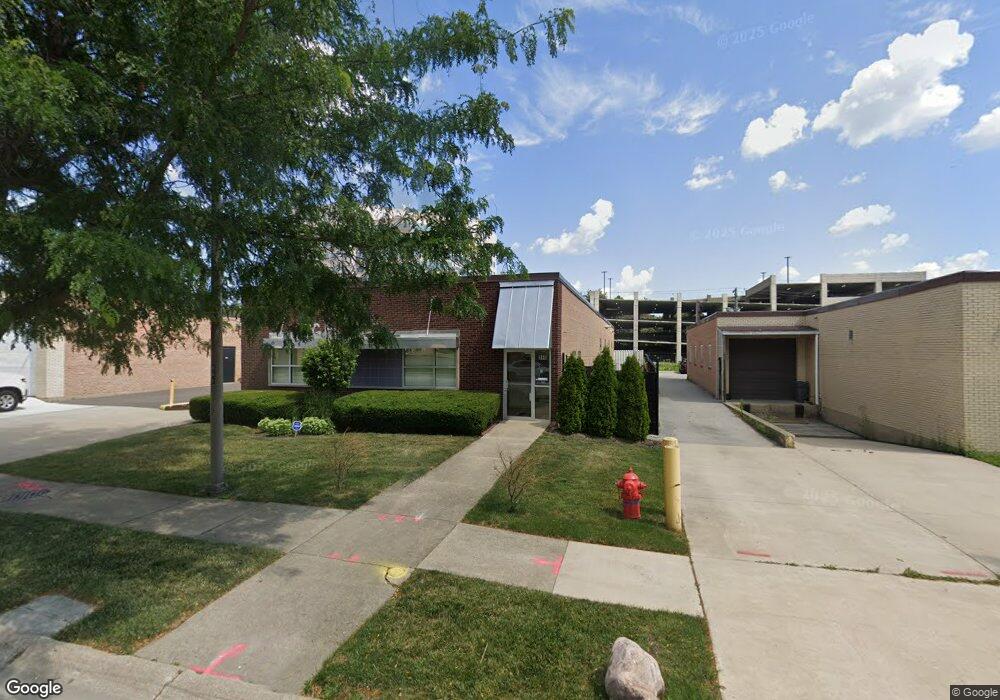
360 Bennett Rd Elk Grove Village, IL 60007
Elk Grove Village East NeighborhoodEstimated Value: $516,945
--
Bed
--
Bath
--
Sq Ft
0.33
Acres
About This Home
This home is located at 360 Bennett Rd, Elk Grove Village, IL 60007 and is currently estimated at $516,945. 360 Bennett Rd is a home located in Cook County with nearby schools including Rupley Elementary School, Grove Jr High School, and Elk Grove High School.
Ownership History
Date
Name
Owned For
Owner Type
Purchase Details
Closed on
Oct 1, 2014
Sold by
Chicago Title Land Trust Company
Bought by
360 Property Llc
Current Estimated Value
Home Financials for this Owner
Home Financials are based on the most recent Mortgage that was taken out on this home.
Original Mortgage
$217,333
Outstanding Balance
$166,556
Interest Rate
4.09%
Mortgage Type
Commercial
Estimated Equity
$350,389
Purchase Details
Closed on
Aug 7, 2002
Sold by
Itasca Bank & Trust Co
Bought by
Lasalle Bank National Assn and Trust #129908
Home Financials for this Owner
Home Financials are based on the most recent Mortgage that was taken out on this home.
Original Mortgage
$247,500
Interest Rate
6.64%
Mortgage Type
Commercial
Purchase Details
Closed on
Sep 25, 1996
Sold by
Limbacher Gayle L
Bought by
Itasca Bank & Trust Co and Trust #11441
Purchase Details
Closed on
Jan 29, 1994
Sold by
Limbacher Gayle L
Bought by
Limbacher Gayle L
Create a Home Valuation Report for This Property
The Home Valuation Report is an in-depth analysis detailing your home's value as well as a comparison with similar homes in the area
Home Values in the Area
Average Home Value in this Area
Purchase History
| Date | Buyer | Sale Price | Title Company |
|---|---|---|---|
| 360 Property Llc | $295,000 | Chicago Title Land Trust Co | |
| Lasalle Bank National Assn | $330,000 | -- | |
| Itasca Bank & Trust Co | $242,000 | -- | |
| Limbacher Gayle L | -- | -- |
Source: Public Records
Mortgage History
| Date | Status | Borrower | Loan Amount |
|---|---|---|---|
| Open | 360 Property Llc | $217,333 | |
| Previous Owner | Lasalle Bank National Assn | $247,500 |
Source: Public Records
Tax History Compared to Growth
Tax History
| Year | Tax Paid | Tax Assessment Tax Assessment Total Assessment is a certain percentage of the fair market value that is determined by local assessors to be the total taxable value of land and additions on the property. | Land | Improvement |
|---|---|---|---|---|
| 2024 | $8,670 | $34,143 | $11,900 | $22,243 |
| 2023 | $8,342 | $34,143 | $11,900 | $22,243 |
| 2022 | $8,342 | $34,143 | $11,900 | $22,243 |
| 2021 | $9,022 | $32,500 | $11,900 | $20,600 |
| 2020 | $8,691 | $32,500 | $11,900 | $20,600 |
| 2019 | $7,912 | $32,500 | $11,900 | $20,600 |
| 2018 | $9,264 | $33,769 | $9,450 | $24,319 |
| 2017 | $9,330 | $34,255 | $9,450 | $24,805 |
| 2016 | $7,505 | $29,500 | $9,450 | $20,050 |
| 2015 | $19,749 | $73,749 | $22,750 | $50,999 |
| 2014 | $19,621 | $74,300 | $22,750 | $51,550 |
| 2013 | $19,178 | $74,300 | $22,750 | $51,550 |
Source: Public Records
Map
Nearby Homes
- 50 Ridgewood Rd
- 510 Oakton St
- 105 Crest Ave
- 2831 S Embers Ln Unit 352831
- 2669 S Embers Ln Unit 142669
- 1107 E Algonquin Rd Unit 4
- 509 Shadywood Ln
- 1119 E Algonquin Rd Unit 7
- 539 Ridgewood Rd
- 1111 E Algonquin Rd Unit 1
- 2315 S Goebbert Rd Unit D209
- 1115 E Algonquin Rd Unit 8
- 2829 S Briarwood Dr E
- 301 S Arlington Heights Rd
- 301 Forest View Ave
- 2342 S Shag Bark Trail
- 532 Landmeier Rd
- 1785 W Algonquin Rd Unit 2A
- 2206 S Goebbert Rd Unit 409
- 2234 S Crambourne Way
- 350 Bennett Rd
- 370 Bennett Rd
- 199 Randall St
- 225 N Arlington Heights Rd Unit 100B
- 225 N Arlington Heights Rd
- 225 N Arlington Heights Rd Unit 113
- 160 Kelly St
- 425 Bennett Rd
- 435 Bennett Rd
- 145 Randall St
- 125 Randall St
- 490 Bennett Rd
- 500 Bennett Rd
- 520 Bennett Rd
- 25 Northwest Point Blvd
- 25 Northwest Point Blvd Unit 925
- 55 Kelly St
- 70 Gordon St
- 83 Gordon St
- 450 E Higgins Rd