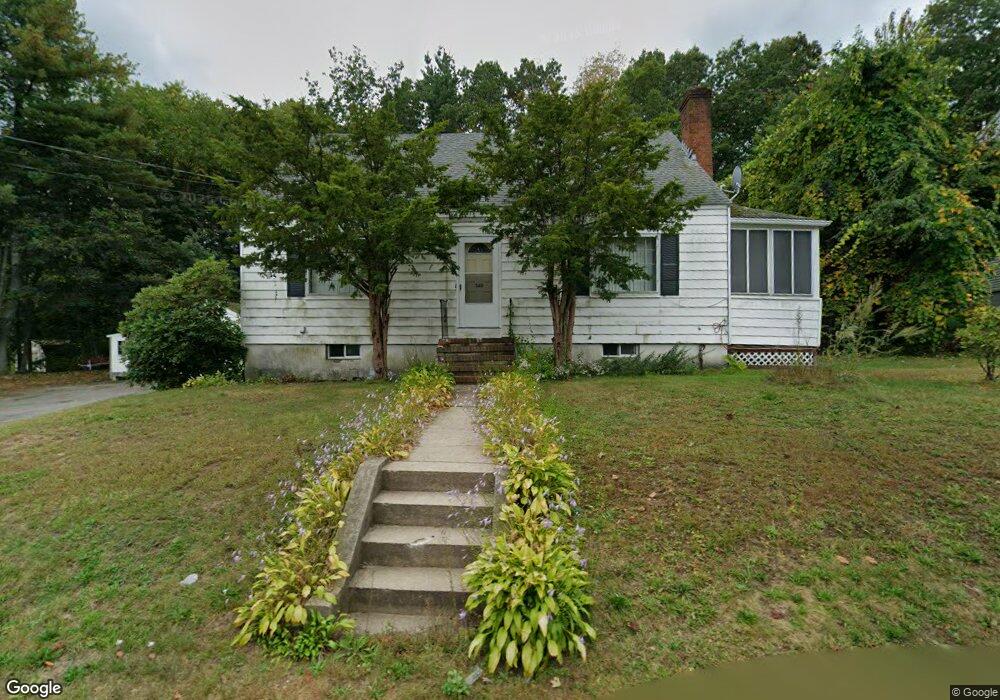
360 Canton St Fitchburg, MA 01420
South Fitchburg NeighborhoodEstimated Value: $439,000 - $470,897
3
Beds
2
Baths
1,764
Sq Ft
$258/Sq Ft
Est. Value
About This Home
This home is located at 360 Canton St, Fitchburg, MA 01420 and is currently estimated at $455,224, approximately $258 per square foot. 360 Canton St is a home located in Worcester County with nearby schools including South Street Elementary School, Reingold Elementary School, and Crocker Elementary School.
Ownership History
Date
Name
Owned For
Owner Type
Purchase Details
Closed on
Sep 5, 2006
Sold by
Khan Rashid M and Khan Zafar M
Bought by
B J Rt and Scola
Current Estimated Value
Purchase Details
Closed on
Jun 30, 2004
Sold by
Rosado Cesar
Bought by
Khan Rashid M and Khan Zafar M
Home Financials for this Owner
Home Financials are based on the most recent Mortgage that was taken out on this home.
Original Mortgage
$175,000
Interest Rate
6.3%
Mortgage Type
Purchase Money Mortgage
Purchase Details
Closed on
Oct 28, 1994
Sold by
Dululio William P and Dululio Sandra
Bought by
Schultz Bernard and Schultz Catherine
Home Financials for this Owner
Home Financials are based on the most recent Mortgage that was taken out on this home.
Original Mortgage
$72,000
Interest Rate
8.65%
Mortgage Type
Purchase Money Mortgage
Create a Home Valuation Report for This Property
The Home Valuation Report is an in-depth analysis detailing your home's value as well as a comparison with similar homes in the area
Home Values in the Area
Average Home Value in this Area
Purchase History
| Date | Buyer | Sale Price | Title Company |
|---|---|---|---|
| B J Rt | $50,000 | -- | |
| Khan Rashid M | $207,000 | -- | |
| Schultz Bernard | $107,000 | -- | |
| B J Rt | $50,000 | -- | |
| Khan Rashid M | $207,000 | -- | |
| Schultz Bernard | $107,000 | -- |
Source: Public Records
Mortgage History
| Date | Status | Borrower | Loan Amount |
|---|---|---|---|
| Previous Owner | Khan Rashid M | $175,000 | |
| Previous Owner | Schultz Bernard | $72,000 |
Source: Public Records
Tax History Compared to Growth
Tax History
| Year | Tax Paid | Tax Assessment Tax Assessment Total Assessment is a certain percentage of the fair market value that is determined by local assessors to be the total taxable value of land and additions on the property. | Land | Improvement |
|---|---|---|---|---|
| 2025 | $48 | $356,000 | $103,100 | $252,900 |
| 2024 | $4,674 | $315,600 | $71,200 | $244,400 |
| 2023 | $4,500 | $280,900 | $61,200 | $219,700 |
| 2022 | $4,244 | $241,000 | $51,300 | $189,700 |
| 2021 | $4,177 | $219,500 | $37,000 | $182,500 |
| 2020 | $3,804 | $193,000 | $34,200 | $158,800 |
| 2019 | $3,468 | $182,300 | $48,400 | $133,900 |
| 2018 | $3,584 | $170,600 | $45,600 | $125,000 |
| 2017 | $3,337 | $155,300 | $45,600 | $109,700 |
| 2016 | $3,136 | $147,700 | $41,300 | $106,400 |
| 2015 | $3,052 | $147,600 | $39,900 | $107,700 |
| 2014 | $2,921 | $147,300 | $39,900 | $107,400 |
Source: Public Records
Map
Nearby Homes
- 156 Belmont St
- 31 Bemis Rd
- 35 Bemis Rd
- 43 Saint Anthony St
- 2 Arden Mills Way Unit 2210
- 20 Pleasantview Ave
- 19 Mount Carmel St
- 505 Old St S
- 535 South St Unit 4-2A
- 535 South St Unit 14-2A
- 1220 Water St
- 55 Canton St
- 55 Smith St
- 1295 Water St
- 29 Bamford Ave
- 62 Hancock St
- 15 Clyde St
- 20 Clyde St
- 48 Woodworth Ave
- 11 Doane St