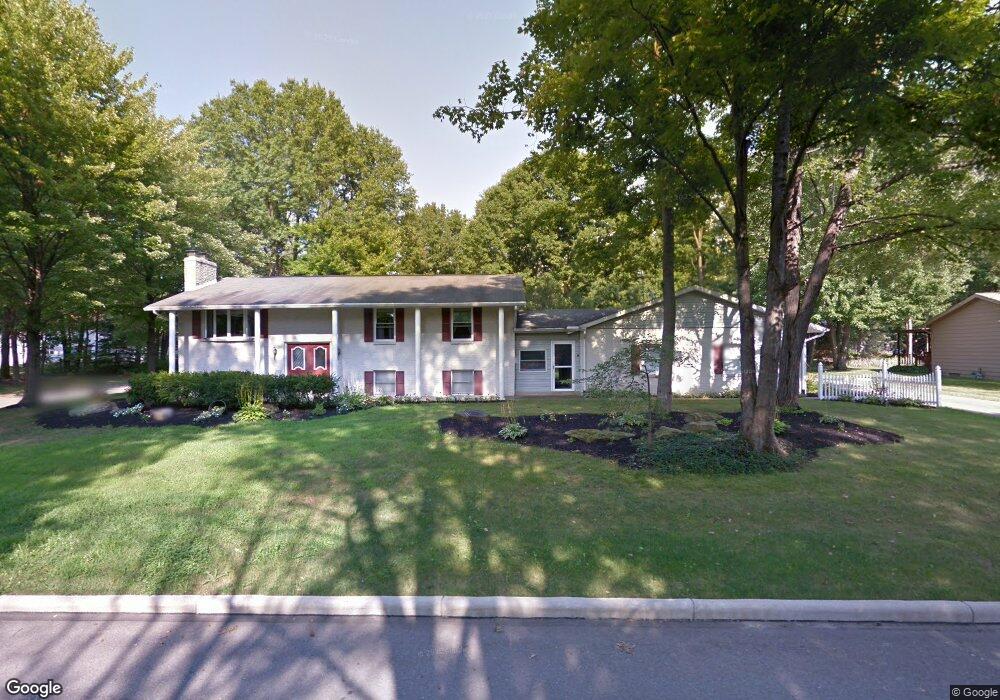
360 Charles Ave Cortland, OH 44410
Estimated Value: $249,000 - $333,000
4
Beds
3
Baths
2,576
Sq Ft
$115/Sq Ft
Est. Value
About This Home
This home is located at 360 Charles Ave, Cortland, OH 44410 and is currently estimated at $296,480, approximately $115 per square foot. 360 Charles Ave is a home located in Trumbull County with nearby schools including Lakeview Elementary School, Lakeview Middle School, and Lakeview High School.
Ownership History
Date
Name
Owned For
Owner Type
Purchase Details
Closed on
Aug 4, 2016
Sold by
Grossman Steven J
Bought by
Grossman Shannon M
Current Estimated Value
Home Financials for this Owner
Home Financials are based on the most recent Mortgage that was taken out on this home.
Original Mortgage
$117,826
Outstanding Balance
$96,701
Interest Rate
4.4%
Mortgage Type
FHA
Estimated Equity
$199,779
Purchase Details
Closed on
Jan 15, 2003
Sold by
London Jeffrey A and London Carolyn A
Bought by
Grossman Steven J and Grossman Shannon M
Purchase Details
Closed on
Aug 5, 1996
Sold by
Pytlik Michael P
Bought by
Baker Vincent B and Baker Louise B
Home Financials for this Owner
Home Financials are based on the most recent Mortgage that was taken out on this home.
Original Mortgage
$133,750
Interest Rate
8.33%
Mortgage Type
New Conventional
Purchase Details
Closed on
Jan 1, 1990
Bought by
Michael Michael P and Michael S
Create a Home Valuation Report for This Property
The Home Valuation Report is an in-depth analysis detailing your home's value as well as a comparison with similar homes in the area
Home Values in the Area
Average Home Value in this Area
Purchase History
| Date | Buyer | Sale Price | Title Company |
|---|---|---|---|
| Grossman Shannon M | $120,000 | Bx Title | |
| Grossman Steven J | $134,000 | -- | |
| Baker Vincent B | $129,900 | -- | |
| Michael Michael P | -- | -- |
Source: Public Records
Mortgage History
| Date | Status | Borrower | Loan Amount |
|---|---|---|---|
| Open | Grossman Shannon M | $117,826 | |
| Previous Owner | Baker Vincent B | $133,750 |
Source: Public Records
Tax History
| Year | Tax Paid | Tax Assessment Tax Assessment Total Assessment is a certain percentage of the fair market value that is determined by local assessors to be the total taxable value of land and additions on the property. | Land | Improvement |
|---|---|---|---|---|
| 2024 | $4,274 | $78,960 | $11,060 | $67,900 |
| 2023 | $4,149 | $78,960 | $11,060 | $67,900 |
| 2022 | $2,719 | $43,370 | $11,060 | $32,310 |
| 2021 | $2,730 | $43,370 | $11,060 | $32,310 |
| 2020 | $2,744 | $43,370 | $11,060 | $32,310 |
| 2019 | $2,673 | $41,270 | $11,060 | $30,210 |
| 2018 | $2,685 | $41,270 | $11,060 | $30,210 |
| 2017 | $3,336 | $51,350 | $11,060 | $40,290 |
| 2016 | $2,824 | $42,000 | $11,060 | $30,940 |
| 2015 | $3,331 | $49,740 | $11,060 | $38,680 |
| 2014 | $2,929 | $49,740 | $11,060 | $38,680 |
| 2013 | $2,982 | $49,740 | $11,060 | $38,680 |
Source: Public Records
Map
Nearby Homes
- 336 S Colonial Dr
- 278 Rosewae Ave
- 151 Cedar Cir
- 384 Fowler St Unit 384
- 319 Russell Ave
- 140 Leckrone Way
- 104 Diamond Way Unit 104
- 2 Harneds Landing
- 111 Emerald Ln
- 120 Winter Ln
- 232 Bayview Dr Unit 232
- 155 Heritage Ln
- 248 Robbies Run
- 144 Winter Ln
- 124 Saint Andrews
- 152 Grove St
- 289 Cricklewood Dr
- 324 Greenbriar Dr
- 0 N High St
- 101 Elizabeth Ct
- 368 Charles Ave
- 361 S Colonial Dr
- 295 Woodview Dr
- 369 S Colonial Dr
- 371 Charles Ave
- 306 Woodview Dr
- 349 S Colonial Dr
- 0 Charles
- 376 Charles Ave
- 296 Woodview Dr
- 377 S Colonial Dr
- 365 Woodview Dr
- 360 S Colonial Dr
- 379 Charles Ave
- 354 S Colonial Dr
- 373 Rosewae Ave
- 368 S Colonial Dr
- 343 S Colonial Dr
- 384 Charles Ave
- 355 Rosewae Ave
Your Personal Tour Guide
Ask me questions while you tour the home.