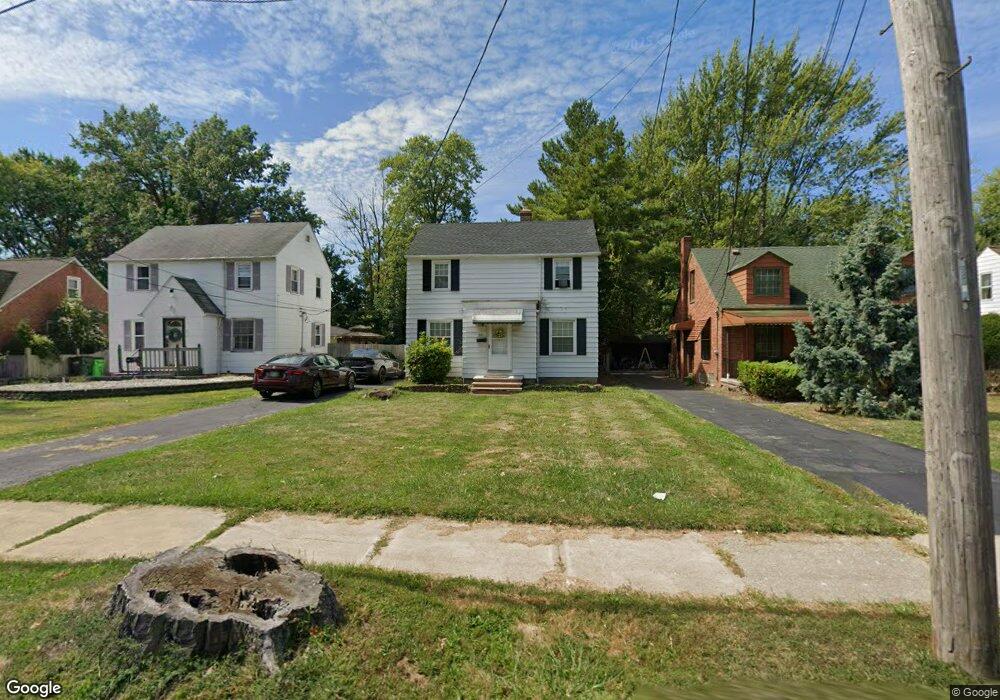
360 E 260th St Euclid, OH 44132
Estimated Value: $124,936 - $169,000
3
Beds
1
Bath
1,215
Sq Ft
$119/Sq Ft
Est. Value
About This Home
This home is located at 360 E 260th St, Euclid, OH 44132 and is currently estimated at $144,234, approximately $118 per square foot. 360 E 260th St is a home located in Cuyahoga County with nearby schools including Shoreview Elementary School, Euclid High School, and Ss Robert & William Catholic School.
Ownership History
Date
Name
Owned For
Owner Type
Purchase Details
Closed on
Oct 23, 2009
Sold by
Wells Fargo Financial Ohio 1 Inc
Bought by
Alfieri James A
Current Estimated Value
Purchase Details
Closed on
Aug 6, 2009
Sold by
Farkas Nancy
Bought by
Wells Fargo Financial Ohio 1 Inc
Purchase Details
Closed on
Mar 20, 1987
Sold by
Garcia James P
Bought by
Farkas Nancy
Purchase Details
Closed on
May 26, 1983
Sold by
Cochran Frank D
Bought by
Garcia James P
Purchase Details
Closed on
Jun 22, 1977
Sold by
Dunlap Garry W and Dunlap Paulette G
Bought by
Cochran Frank D
Purchase Details
Closed on
Jan 1, 1975
Bought by
Dunlap Garry W and Dunlap Paulette G
Create a Home Valuation Report for This Property
The Home Valuation Report is an in-depth analysis detailing your home's value as well as a comparison with similar homes in the area
Home Values in the Area
Average Home Value in this Area
Purchase History
| Date | Buyer | Sale Price | Title Company |
|---|---|---|---|
| Alfieri James A | $20,000 | Rels Title | |
| Wells Fargo Financial Ohio 1 Inc | $13,334 | None Available | |
| Farkas Nancy | $60,000 | -- | |
| Garcia James P | $45,000 | -- | |
| Cochran Frank D | $38,000 | -- | |
| Dunlap Garry W | -- | -- |
Source: Public Records
Tax History
| Year | Tax Paid | Tax Assessment Tax Assessment Total Assessment is a certain percentage of the fair market value that is determined by local assessors to be the total taxable value of land and additions on the property. | Land | Improvement |
|---|---|---|---|---|
| 2024 | $3,020 | $42,945 | $7,490 | $35,455 |
| 2023 | $2,771 | $31,360 | $8,225 | $23,135 |
| 2022 | $2,709 | $31,360 | $8,230 | $23,140 |
| 2021 | $3,021 | $31,360 | $8,230 | $23,140 |
| 2020 | $2,868 | $27,060 | $7,110 | $19,950 |
| 2019 | $2,583 | $77,300 | $20,300 | $57,000 |
| 2018 | $1,849 | $27,060 | $7,110 | $19,950 |
| 2017 | $1,197 | $9,810 | $4,590 | $5,220 |
| 2016 | $1,199 | $9,810 | $4,590 | $5,220 |
| 2015 | $1,099 | $9,810 | $4,590 | $5,220 |
| 2014 | $1,099 | $9,810 | $4,590 | $5,220 |
Source: Public Records
Map
Nearby Homes
- 325 E 257th St
- 355 E 257th St
- 364 Walworth Ave
- 325 E 264th St
- 25731 Zeman Ave
- 110 E 252nd St
- 26530 Shoreview Ave
- 25801 Lakeshore Blvd Unit 42
- 610 E 266th St
- 571 E 260th St
- 25801 Lake Shore Blvd Unit 29
- 25801 Lake Shore Blvd Unit 25
- 25801 Lake Shore Blvd Unit 112
- 25801 Lake Shore Blvd Unit 85
- 25671 Farringdon Ave
- 26831 Shoreview Ave
- 579 E 260th St
- 440 E 271st St
- 25151 Zeman Ave
- 25401 Farringdon Ave
- 354 E 260th St
- 364 E 260th St
- 350 E 260th St
- 370 E 260th St
- 344 E 260th St
- 374 E 260th St
- 335 E 257th St
- 341 E 257th St
- 331 E 257th St
- 340 E 260th St
- 380 E 260th St
- 345 E 257th St
- 321 E 257th St
- 351 E 257th St
- 334 E 260th St
- 384 E 260th St
- 319 E 257th St
- 330 E 260th St
- 315 E 257th St
- 25831 Forestview Ave
Your Personal Tour Guide
Ask me questions while you tour the home.