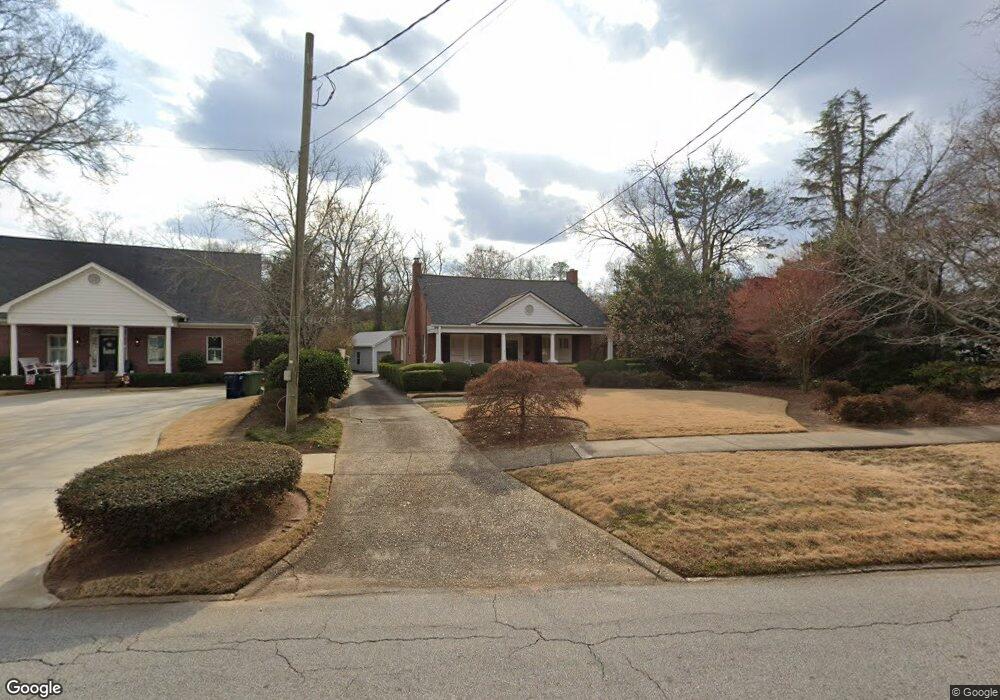
360 E College St Griffin, GA 30224
Spalding County NeighborhoodEstimated Value: $265,000 - $317,000
2
Beds
2
Baths
1,957
Sq Ft
$147/Sq Ft
Est. Value
About This Home
This home is located at 360 E College St, Griffin, GA 30224 and is currently estimated at $286,933, approximately $146 per square foot. 360 E College St is a home located in Spalding County with nearby schools including Futral Road Elementary School, Rehoboth Road Middle School, and Spalding High School.
Ownership History
Date
Name
Owned For
Owner Type
Purchase Details
Closed on
Dec 11, 1998
Sold by
Connell John Samuel and Smith Ange
Bought by
Dennis Claudia Fields
Current Estimated Value
Purchase Details
Closed on
Nov 25, 1996
Sold by
Tye J Pearce
Bought by
Connell John S and Smith Angela D
Purchase Details
Closed on
Jan 31, 1991
Sold by
Galloway Newton M and Galloway Race Teri L
Bought by
Tye J Pearce
Purchase Details
Closed on
Jul 29, 1988
Sold by
Imes Ann B
Bought by
Galloway Newton M and Race Teri L
Purchase Details
Closed on
Jun 21, 1984
Sold by
Moore Ginger Kay
Bought by
Imes Ann B
Purchase Details
Closed on
Jan 14, 1983
Sold by
Newsome Florine Hatton
Bought by
Hatton John B and Ginger Kay Moore
Purchase Details
Closed on
Feb 5, 1974
Sold by
Newsom Dr C C
Bought by
Newsome Florine Hatton
Purchase Details
Closed on
Jan 1, 1973
Sold by
Newsom Dr C C
Bought by
Newsome Florine Hatton
Purchase Details
Closed on
Oct 13, 1966
Sold by
Bell George C
Bought by
Newsom Dr C C
Create a Home Valuation Report for This Property
The Home Valuation Report is an in-depth analysis detailing your home's value as well as a comparison with similar homes in the area
Home Values in the Area
Average Home Value in this Area
Purchase History
| Date | Buyer | Sale Price | Title Company |
|---|---|---|---|
| Dennis Claudia Fields | $134,500 | -- | |
| Connell John S | $121,500 | -- | |
| Tye J Pearce | $86,500 | -- | |
| Galloway Newton M | $83,000 | -- | |
| Imes Ann B | $51,000 | -- | |
| Moore Ginger Kay | -- | -- | |
| Hatton John B | -- | -- | |
| Newsome Florine Hatton | -- | -- | |
| Newsome Florine Hatton | -- | -- | |
| Newsom Dr C C | $18,200 | -- |
Source: Public Records
Mortgage History
| Date | Status | Borrower | Loan Amount |
|---|---|---|---|
| Closed | Connell John S | $0 |
Source: Public Records
Tax History
| Year | Tax Paid | Tax Assessment Tax Assessment Total Assessment is a certain percentage of the fair market value that is determined by local assessors to be the total taxable value of land and additions on the property. | Land | Improvement |
|---|---|---|---|---|
| 2025 | $1,764 | $83,290 | $12,600 | $70,690 |
| 2024 | $1,724 | $83,290 | $12,600 | $70,690 |
| 2023 | $1,764 | $83,290 | $12,600 | $70,690 |
| 2022 | $1,842 | $74,241 | $10,800 | $63,441 |
| 2021 | $1,654 | $65,428 | $10,800 | $54,628 |
| 2020 | $1,695 | $65,428 | $10,800 | $54,628 |
| 2019 | $1,237 | $44,778 | $10,800 | $33,978 |
| 2018 | $1,390 | $41,823 | $10,800 | $31,023 |
| 2017 | $1,200 | $37,893 | $10,800 | $27,093 |
| 2016 | $1,131 | $35,819 | $10,800 | $25,019 |
| 2015 | $1,278 | $35,819 | $10,800 | $25,019 |
| 2014 | $1,315 | $35,819 | $10,800 | $25,019 |
Source: Public Records
Map
Nearby Homes
- 123 Huntsman Dr
- 372 E College St
- 323 E College St
- 319 E College St
- 517 S 6th St
- 136 4th St
- 550 S Hill St
- 406 E Solomon St
- 606 E Wall St
- 644 Brook Cir
- 310 Terrace St
- 411 Terrace St
- 102 N Hill St Unit 302
- 102 N Hill St Unit 304
- 102 N Hill St Unit 303
- 319 E Broadway St
- 321 E Broadway St
- 123 N Brawner St
- 402 Meriwether St
- 216 N 6th St
- 366 E College St
- 356 E College St
- 125 Huntsman Dr Unit (LOT 7)
- 137 Huntsman Dr Unit (LOT 9)
- 125 Huntsman Dr Unit LOT 07
- 137 Huntsman Dr Unit LOT 09
- 131 Huntsman Dr
- 137 Huntsman Dr
- 125 Huntsman Dr
- 126 Huntsman Dr Unit LOT FC15
- 138 Huntsman Dr Unit LOT FC13
- 134 Huntsman Dr Unit LOT FC14
- 140 Huntsman Dr Unit LOT FC12
- 140 Huntsman Dr Unit FC12
- 117 Huntsman Dr Unit LOT FC 5
- 123 Huntsman Dr Unit LOT 6
- 346 E College St
- 369 E College St
- 70 Terracedale Ct
- 68 Terracedale Ct
Your Personal Tour Guide
Ask me questions while you tour the home.