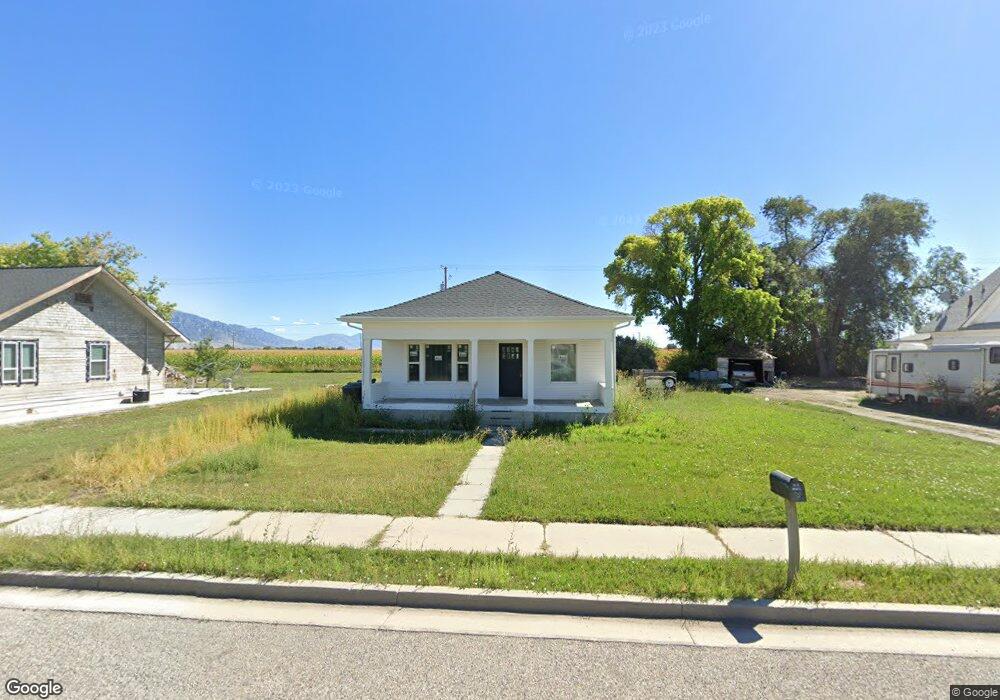
360 E Factory St Garland, UT 84312
Estimated Value: $296,000 - $331,392
4
Beds
1
Bath
1,632
Sq Ft
$195/Sq Ft
Est. Value
About This Home
This home is located at 360 E Factory St, Garland, UT 84312 and is currently estimated at $318,348, approximately $195 per square foot. 360 E Factory St is a home located in Box Elder County with nearby schools including Garland School, Bear River Middle School, and Alice C. Harris Intermediate School.
Ownership History
Date
Name
Owned For
Owner Type
Purchase Details
Closed on
Sep 9, 2022
Sold by
Thompson Heath R
Bought by
Andersen Terry and Andersen Julia
Current Estimated Value
Purchase Details
Closed on
Sep 7, 2022
Sold by
Thompson Brothers Properties Llc
Bought by
Thompson Heath R
Purchase Details
Closed on
Aug 26, 2005
Sold by
Thompson Heath R
Bought by
Thompson Heath R and Thompson Michael Don
Home Financials for this Owner
Home Financials are based on the most recent Mortgage that was taken out on this home.
Original Mortgage
$61,200
Interest Rate
5.61%
Mortgage Type
New Conventional
Purchase Details
Closed on
Aug 25, 2005
Sold by
Veibell Fred H and Veibell Grace K
Bought by
Thompson Heath R
Home Financials for this Owner
Home Financials are based on the most recent Mortgage that was taken out on this home.
Original Mortgage
$61,200
Interest Rate
5.61%
Mortgage Type
New Conventional
Create a Home Valuation Report for This Property
The Home Valuation Report is an in-depth analysis detailing your home's value as well as a comparison with similar homes in the area
Home Values in the Area
Average Home Value in this Area
Purchase History
| Date | Buyer | Sale Price | Title Company |
|---|---|---|---|
| Andersen Terry | -- | -- | |
| Thompson Heath R | -- | Us Title | |
| Thompson Heath R | -- | American Sercure Title | |
| Thompson Heath R | -- | American Sercure Title |
Source: Public Records
Mortgage History
| Date | Status | Borrower | Loan Amount |
|---|---|---|---|
| Previous Owner | Thompson Heath R | $61,200 | |
| Previous Owner | Thompson Heath R | $34,000 |
Source: Public Records
Tax History
| Year | Tax Paid | Tax Assessment Tax Assessment Total Assessment is a certain percentage of the fair market value that is determined by local assessors to be the total taxable value of land and additions on the property. | Land | Improvement |
|---|---|---|---|---|
| 2025 | $1,947 | $297,002 | $105,000 | $192,002 |
| 2024 | $1,683 | $289,020 | $100,000 | $189,020 |
| 2023 | $1,542 | $261,134 | $90,000 | $171,134 |
| 2022 | $1,408 | $223,652 | $25,000 | $198,652 |
| 2021 | $1,144 | $135,717 | $25,000 | $110,717 |
| 2020 | $976 | $135,717 | $25,000 | $110,717 |
| 2019 | $918 | $67,639 | $13,750 | $53,889 |
| 2018 | $723 | $49,817 | $13,750 | $36,067 |
| 2017 | $751 | $90,577 | $13,750 | $65,577 |
| 2016 | $713 | $48,100 | $13,750 | $34,350 |
| 2015 | $674 | $44,977 | $13,750 | $31,227 |
| 2014 | $674 | $43,490 | $13,750 | $29,740 |
| 2013 | -- | $43,491 | $13,338 | $30,153 |
Source: Public Records
Map
Nearby Homes
- 336 E Factory Rd
- 336 E Factory St
- 312 E Factory St
- 1400 S 400 E
- 1383 S 400 E Unit 7
- 371 E Factory St
- 410 E Factory St
- 337 E Factory St
- 311 E Factory St
- 420 E Factory St
- 49 N 400 E
- 411 E Factory St
- 286 E Factory St
- 287 E Factory St
- 360 E 100 N
- 437 E Factory St Unit 484
- 460 E Factory St
- 87 N 400 E
- 262 E Factory St
- 463 E Factory Rd
Your Personal Tour Guide
Ask me questions while you tour the home.