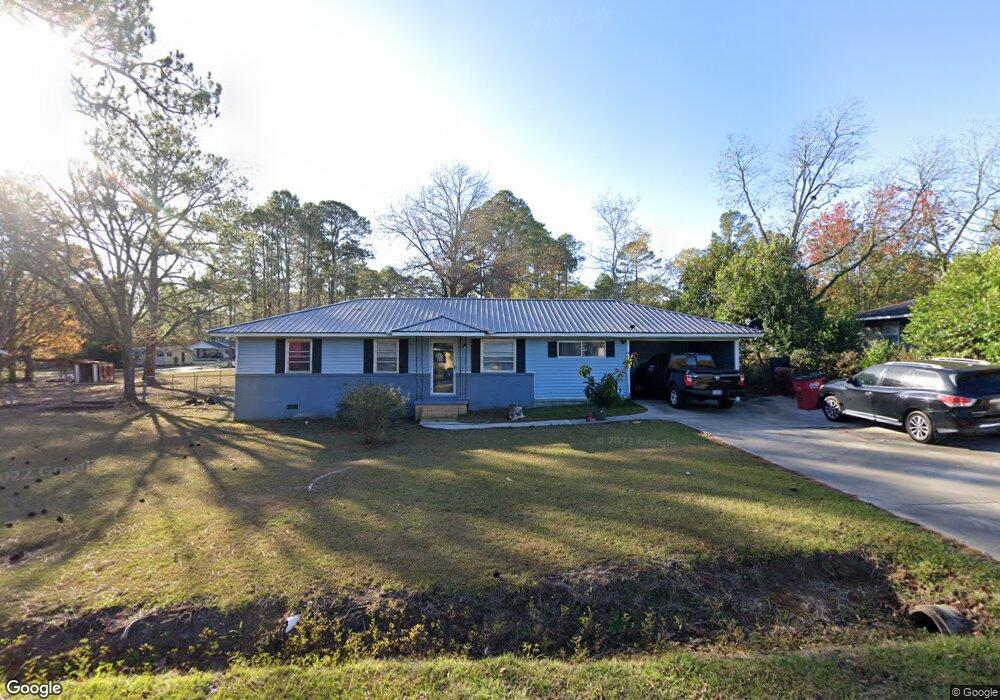
360 Elizabeth Cir Tifton, GA 31794
Estimated Value: $201,000 - $241,000
4
Beds
2
Baths
1,729
Sq Ft
$125/Sq Ft
Est. Value
About This Home
This home is located at 360 Elizabeth Cir, Tifton, GA 31794 and is currently estimated at $215,776, approximately $124 per square foot. 360 Elizabeth Cir is a home located in Tift County with nearby schools including Northside Primary School, Charles Spencer Elementary School, and J.T. Reddick School.
Ownership History
Date
Name
Owned For
Owner Type
Purchase Details
Closed on
Mar 17, 2020
Sold by
Secretary Of Housing And Urban Developme
Bought by
Greene Leona W and Greene Leon
Current Estimated Value
Purchase Details
Closed on
Jan 6, 2020
Sold by
Carrington Mtg Svcs Llc
Bought by
Secretary Of Housing And Urban Developme and C/O Shepherd Mall Office Complex
Purchase Details
Closed on
Dec 3, 2019
Sold by
Daughtrey Margie V
Bought by
Carrington Mtg Svcs Llc
Purchase Details
Closed on
Jan 25, 2016
Sold by
Daughtrey V Margie
Bought by
Daughtrey Vickers H
Purchase Details
Closed on
Jun 8, 1990
Sold by
Kennedy Yvonne
Bought by
Daughtrey Margie V
Purchase Details
Closed on
Jan 23, 1981
Sold by
Kennedy Larry D
Bought by
Smith Yvonne Fka Kennedy
Purchase Details
Closed on
Jul 27, 1976
Sold by
Alsobrook Martin Cyrus and Alsobrook Sandra
Bought by
Kennedy Larry D and Kennedy Yvone
Create a Home Valuation Report for This Property
The Home Valuation Report is an in-depth analysis detailing your home's value as well as a comparison with similar homes in the area
Home Values in the Area
Average Home Value in this Area
Purchase History
| Date | Buyer | Sale Price | Title Company |
|---|---|---|---|
| Greene Leona W | $73,400 | -- | |
| Secretary Of Housing And Urban Developme | -- | -- | |
| Carrington Mtg Svcs Llc | $80,850 | -- | |
| Daughtrey Vickers H | -- | -- | |
| Daughtrey Margie V | $49,000 | -- | |
| Smith Yvonne Fka Kennedy | $3,400 | -- | |
| Kennedy Larry D | $25,000 | -- |
Source: Public Records
Tax History Compared to Growth
Tax History
| Year | Tax Paid | Tax Assessment Tax Assessment Total Assessment is a certain percentage of the fair market value that is determined by local assessors to be the total taxable value of land and additions on the property. | Land | Improvement |
|---|---|---|---|---|
| 2024 | $1,880 | $83,648 | $8,000 | $75,648 |
| 2023 | $2,006 | $35,614 | $3,200 | $32,414 |
| 2022 | $806 | $35,694 | $3,200 | $32,494 |
| 2021 | $634 | $29,705 | $3,200 | $26,505 |
| 2020 | $1,146 | $29,513 | $3,200 | $26,313 |
| 2019 | $641 | $29,513 | $3,200 | $26,313 |
| 2018 | $641 | $29,513 | $3,200 | $26,313 |
| 2017 | $661 | $29,513 | $3,200 | $26,313 |
| 2016 | $661 | $29,513 | $3,200 | $26,313 |
| 2015 | $661 | $29,513 | $3,200 | $26,313 |
| 2014 | $661 | $29,513 | $3,200 | $26,313 |
| 2013 | -- | $29,512 | $3,200 | $26,312 |
Source: Public Records
Map
Nearby Homes
- 2411 Davis Ave
- 2417 Belmont Ave
- 2612 Goff St
- 2020 Davis Ave
- 2021 Davis Ave
- 903 42nd St E
- 714 44th St E
- 0 44th St E
- 717 E 44th St
- 705 20th St E
- 2214 Love Ave
- 0 E 46th St
- 913 E 46th St
- 502 20th St E
- 1809 Davis Ave
- 346 Somers Ln
- 0 Old Ocilla Rd Unit 138781
- 0 Old Ocilla Rd Unit 10611000
- -0- Old Ocilla Rd
- 1611 Love Ave
- 356 Elizabeth Cir
- 364 Elizabeth Cir
- 352 Elizabeth Cir
- 2624 Davis Ave
- 368 Elizabeth Cir
- 359 Elizabeth Cir
- 355 Elizabeth Cir
- 2621 Diana Cir
- 1 Elizabeth Cir
- 3 Elizabeth Cir
- 2620 Davis Ave
- 9 Elizabeth Cir
- 11 Elizabeth Cir
- 348 Elizabeth Cir
- 351 Elizabeth Cir
- 7 Elizabeth Dr
- 6 Elizabeth Dr
- 5 Elizabeth Dr
- 0 E 28th St
- 710 E 28th St