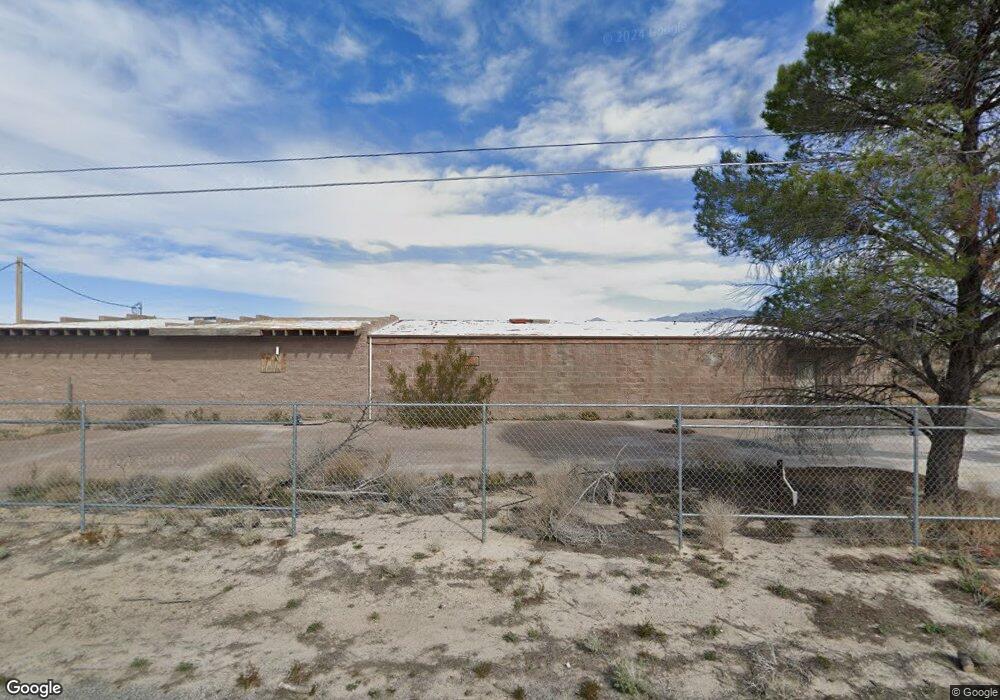
360 Gemini Dr Pahrump, NV 89060
Estimated Value: $259,000 - $433,000
--
Bed
--
Bath
3,461
Sq Ft
$109/Sq Ft
Est. Value
About This Home
This home is located at 360 Gemini Dr, Pahrump, NV 89060 and is currently estimated at $375,672, approximately $108 per square foot. 360 Gemini Dr is a home with nearby schools including Manse Elementary School, Rosemary Clarke Middle School, and Pahrump Valley High School.
Ownership History
Date
Name
Owned For
Owner Type
Purchase Details
Closed on
Dec 4, 2015
Sold by
Sterling Lynn M
Bought by
Sterling A Justin
Current Estimated Value
Purchase Details
Closed on
Dec 1, 2015
Sold by
Sterling A Justin
Bought by
Millett Melvyn
Purchase Details
Closed on
Mar 31, 2008
Sold by
Kornfein Gary Kurt
Bought by
Sterling A Justin
Purchase Details
Closed on
Apr 25, 2006
Sold by
Sterling A Justin
Bought by
Kornfein Gary Kurt
Home Financials for this Owner
Home Financials are based on the most recent Mortgage that was taken out on this home.
Original Mortgage
$205,000
Interest Rate
6.29%
Mortgage Type
Seller Take Back
Purchase Details
Closed on
Apr 3, 2006
Sold by
Sterling Lynn M
Bought by
Sterling A Justin
Home Financials for this Owner
Home Financials are based on the most recent Mortgage that was taken out on this home.
Original Mortgage
$205,000
Interest Rate
6.29%
Mortgage Type
Seller Take Back
Create a Home Valuation Report for This Property
The Home Valuation Report is an in-depth analysis detailing your home's value as well as a comparison with similar homes in the area
Home Values in the Area
Average Home Value in this Area
Purchase History
| Date | Buyer | Sale Price | Title Company |
|---|---|---|---|
| Sterling A Justin | -- | None Available | |
| Millett Melvyn | $40,000 | None Available | |
| Sterling A Justin | $251,490 | Chicago Title | |
| Kornfein Gary Kurt | $220,000 | Chicago Title | |
| Sterling A Justin | -- | Chicago Title |
Source: Public Records
Mortgage History
| Date | Status | Borrower | Loan Amount |
|---|---|---|---|
| Previous Owner | Kornfein Gary Kurt | $205,000 |
Source: Public Records
Tax History Compared to Growth
Tax History
| Year | Tax Paid | Tax Assessment Tax Assessment Total Assessment is a certain percentage of the fair market value that is determined by local assessors to be the total taxable value of land and additions on the property. | Land | Improvement |
|---|---|---|---|---|
| 2025 | $1,644 | $46,575 | $6,603 | $39,972 |
| 2024 | $1,644 | $48,048 | $5,475 | $42,573 |
| 2023 | $1,644 | $44,575 | $5,475 | $39,100 |
| 2022 | $1,412 | $40,393 | $5,475 | $34,918 |
| 2021 | $1,348 | $38,427 | $4,380 | $34,047 |
| 2020 | $1,368 | $39,030 | $4,380 | $34,650 |
| 2019 | $1,515 | $43,574 | $4,380 | $39,194 |
| 2018 | $1,448 | $41,400 | $3,504 | $37,896 |
| 2017 | $1,443 | $41,223 | $3,504 | $37,719 |
| 2016 | $1,452 | $41,241 | $3,504 | $37,737 |
| 2015 | $1,459 | $45,351 | $3,504 | $41,847 |
| 2014 | $1,599 | $45,156 | $3,505 | $41,651 |
Source: Public Records
Map
Nearby Homes
- 120 Abilene St
- 181 Abilene St
- 361 Abilene St
- 61 Abilene St
- 520 Thomas Ln
- 13901 N Globe Ave
- 781 Boothill Dr
- 111 Huascaran St
- 151 Huascaran St
- 171 Huascaran St
- 861 E Valiant Ave
- 841 E Valiant Ave
- 780 E Valiant Ave
- 580 Marfil Ave
- 871 Marfil Ave
- 871 E Valiant Ave
- 831 E Valiant Ave
- 640 Buckhorn Ave
- 620 Cardon
- 151 Tioga Cir
- 391 Gemini Dr
- 390 Gemini Dr
- 300 Gemini Dr
- 421 Gemini Dr
- 420 E Gemini Dr
- 155 Gemini Dr
- 390 2t Ranch Ln
- 230 Gemini Dr
- 220 E Betty Ave
- 480 E Gemini Dr
- 420 2t Ranch Ln
- 420 2 T Ranch Ln
- 440 Central Ave
- 651 E Betty Ave
- 750 E Betty Ave
- 271 E Betty Ave
- 200 Gemini Dr
- 201 E Betty Ave
- 210 2t Ranch Ln
- 170 Gemini Dr