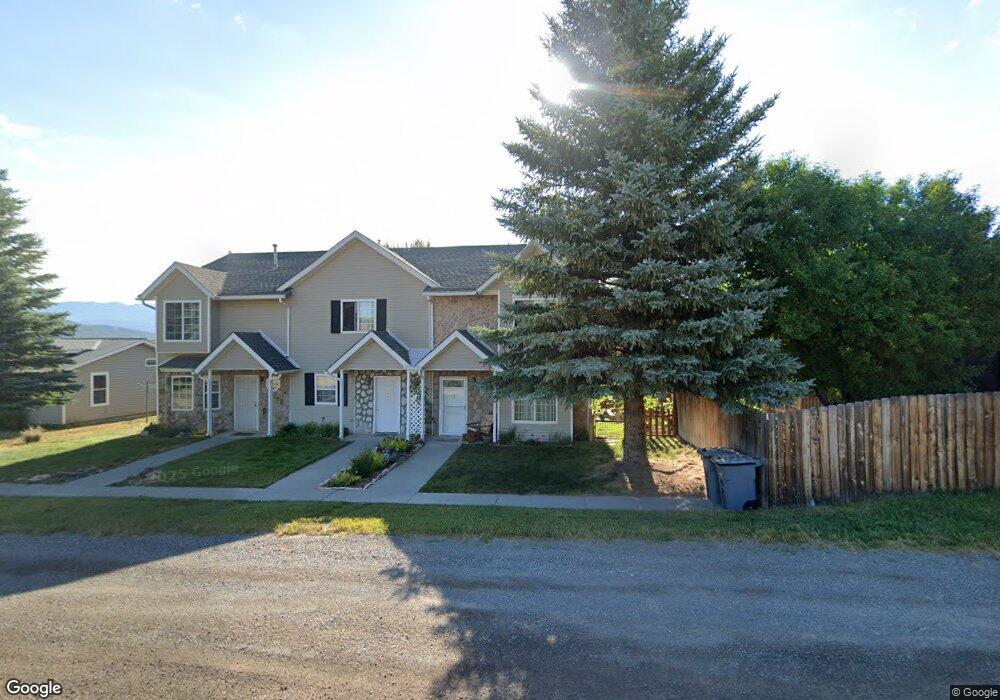
360 Mary Ridgway, CO 81432
Estimated Value: $563,803 - $681,000
3
Beds
2
Baths
1,112
Sq Ft
$542/Sq Ft
Est. Value
About This Home
This home is located at 360 Mary, Ridgway, CO 81432 and is currently estimated at $603,201, approximately $542 per square foot. 360 Mary is a home located in Ouray County with nearby schools including Ridgway Elementary School, Ridgway Middle School, and Ridgway High School.
Ownership History
Date
Name
Owned For
Owner Type
Purchase Details
Closed on
May 26, 2021
Sold by
Jackson Tanya L
Bought by
Jackson Tanya L and The Trust Of Tanya L Jackson
Current Estimated Value
Home Financials for this Owner
Home Financials are based on the most recent Mortgage that was taken out on this home.
Original Mortgage
$116,400
Outstanding Balance
$105,386
Interest Rate
2.9%
Mortgage Type
New Conventional
Estimated Equity
$497,815
Purchase Details
Closed on
May 14, 2013
Sold by
Phelps Marjorie Alice
Bought by
Jackson Tanya L
Home Financials for this Owner
Home Financials are based on the most recent Mortgage that was taken out on this home.
Original Mortgage
$130,400
Interest Rate
3.56%
Mortgage Type
New Conventional
Purchase Details
Closed on
Dec 8, 2009
Sold by
Phelps Marjorie H
Bought by
Phelps Marjorie Alice
Home Financials for this Owner
Home Financials are based on the most recent Mortgage that was taken out on this home.
Original Mortgage
$153,664
Interest Rate
5.06%
Mortgage Type
FHA
Create a Home Valuation Report for This Property
The Home Valuation Report is an in-depth analysis detailing your home's value as well as a comparison with similar homes in the area
Home Values in the Area
Average Home Value in this Area
Purchase History
| Date | Buyer | Sale Price | Title Company |
|---|---|---|---|
| Jackson Tanya L | -- | Amrock | |
| Jackson Tanya L | -- | Amrock | |
| Jackson Tanya L | $163,000 | Land Title Guarantee Company | |
| Phelps Marjorie Alice | $156,500 | Land Title Guarantee Company |
Source: Public Records
Mortgage History
| Date | Status | Borrower | Loan Amount |
|---|---|---|---|
| Open | Jackson Tanya L | $116,400 | |
| Closed | Jackson Tanya L | $130,400 | |
| Previous Owner | Phelps Marjorie Alice | $153,664 |
Source: Public Records
Tax History Compared to Growth
Tax History
| Year | Tax Paid | Tax Assessment Tax Assessment Total Assessment is a certain percentage of the fair market value that is determined by local assessors to be the total taxable value of land and additions on the property. | Land | Improvement |
|---|---|---|---|---|
| 2024 | $1,927 | $30,230 | $5,740 | $24,490 |
| 2023 | $1,927 | $33,230 | $6,310 | $26,920 |
| 2022 | $1,177 | $17,260 | $2,460 | $14,800 |
| 2021 | $1,114 | $17,750 | $2,530 | $15,220 |
| 2020 | $886 | $15,270 | $2,550 | $12,720 |
| 2019 | $886 | $15,270 | $2,550 | $12,720 |
| 2018 | $744 | $12,380 | $1,880 | $10,500 |
| 2017 | $733 | $12,380 | $1,880 | $10,500 |
| 2016 | $780 | $12,780 | $1,840 | $10,940 |
| 2015 | -- | $12,780 | $1,840 | $10,940 |
| 2012 | -- | $12,770 | $3,690 | $9,080 |
Source: Public Records
Map
Nearby Homes
- 0 N Laura St Unit 43434
- Lot 21 N Laura St
- 185 N Lena St Unit ''E''
- 185 N Lena St Unit CONDO "D"
- 185 N Lena St Unit CONDO "E"
- TBD 13-16 Hyde St
- 134 S Charlotte St
- 0 Hyde St Unit 13-16 43656
- 0 Colorado 62
- 280 S Elizabeth St
- Lot 4 Marie St Unit 4
- Lot 4 Marie St
- 0 Tbd Hyde St Unit 24-13 REC4616393
- TBD Sherman St
- 5 Marie St Unit 5
- 320 S Amelia St
- 409 Kismet St Unit 302
- TBD Tract 13 County Road 5
- TBD Tract 10 County Road 5
- 0 County Road 5 Unit 13 42059
- N Mary St
- 370 Mary
- 366 N Mary St
- 751 Charles St
- 733 Charles St
- 377 N Laura St
- 719 Charles St
- 381 N Laura St
- 750 Charles St
- 291 N Mary St
- 754 Charles St
- Lot B Charles St
- 756 Charles St
- 0 N Laura St Unit 42975
- 0 N Laura St Unit 14 768717
- 0 N Laura St Unit 11 42389
- 0 N Laura St Unit 42078
- 0 N Laura St Unit 7 42078
- 0 N Laura St Unit 809212
- 0 N Laura St Unit 12 41335