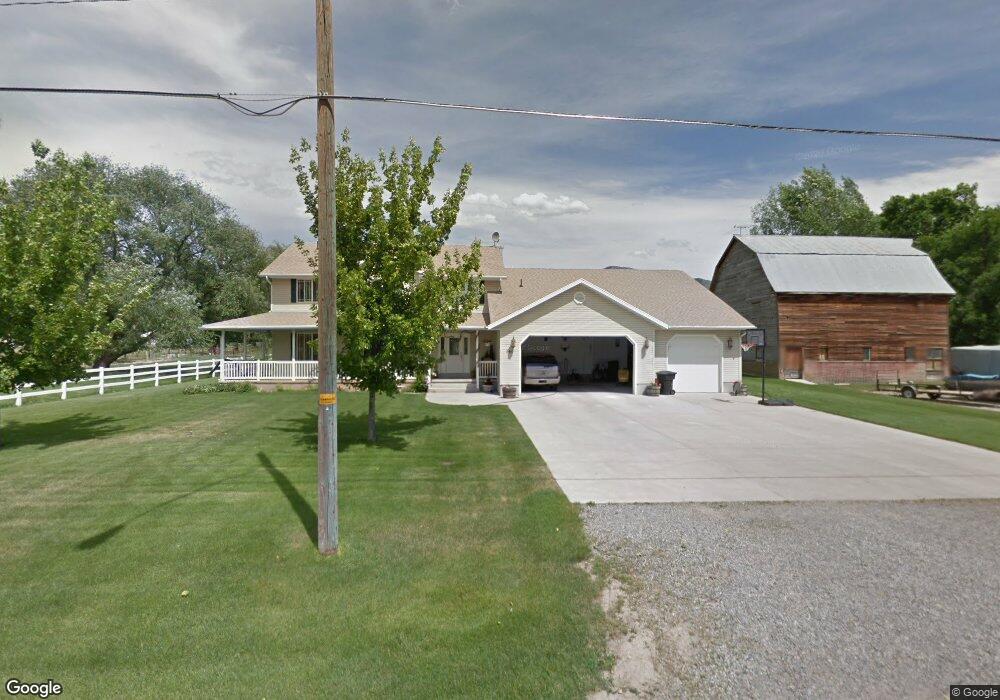
360 N 200 W Hyde Park, UT 84318
Estimated Value: $624,000 - $782,000
--
Bed
--
Bath
3,280
Sq Ft
$217/Sq Ft
Est. Value
About This Home
This home is located at 360 N 200 W, Hyde Park, UT 84318 and is currently estimated at $713,356, approximately $217 per square foot. 360 N 200 W is a home with nearby schools including Summit School, Cedar Ridge School, and Cedar Ridge Middle School.
Ownership History
Date
Name
Owned For
Owner Type
Purchase Details
Closed on
Jan 14, 2009
Sold by
Mortimer Dana P
Bought by
Bair Bart L and Bair Dana P
Current Estimated Value
Home Financials for this Owner
Home Financials are based on the most recent Mortgage that was taken out on this home.
Original Mortgage
$180,000
Outstanding Balance
$116,302
Interest Rate
5.6%
Mortgage Type
New Conventional
Estimated Equity
$597,054
Purchase Details
Closed on
May 19, 2006
Sold by
Mortimer Dana P
Bought by
Mortimer Dana P
Home Financials for this Owner
Home Financials are based on the most recent Mortgage that was taken out on this home.
Original Mortgage
$180,000
Interest Rate
6.41%
Mortgage Type
New Conventional
Purchase Details
Closed on
Sep 8, 2005
Sold by
Mortimer Bryan J and Mortimer Dana P
Bought by
Mortimer Dana P
Purchase Details
Closed on
Sep 20, 2002
Sold by
Petersen Douglas Kent and Petersen Janet H
Bought by
Mortimer Bryan J and Mortimer Dana P
Create a Home Valuation Report for This Property
The Home Valuation Report is an in-depth analysis detailing your home's value as well as a comparison with similar homes in the area
Home Values in the Area
Average Home Value in this Area
Purchase History
| Date | Buyer | Sale Price | Title Company |
|---|---|---|---|
| Bair Bart L | -- | American Secure Title | |
| Mortimer Dana P | -- | American Secure Title | |
| Mortimer Dana P | -- | Cache Title Company | |
| Mortimer Bryan J | -- | Cache Title Company |
Source: Public Records
Mortgage History
| Date | Status | Borrower | Loan Amount |
|---|---|---|---|
| Open | Bair Bart L | $180,000 | |
| Previous Owner | Mortimer Dana P | $180,000 |
Source: Public Records
Tax History Compared to Growth
Tax History
| Year | Tax Paid | Tax Assessment Tax Assessment Total Assessment is a certain percentage of the fair market value that is determined by local assessors to be the total taxable value of land and additions on the property. | Land | Improvement |
|---|---|---|---|---|
| 2024 | $30 | $379,100 | $0 | $0 |
| 2023 | $3,020 | $365,260 | $0 | $0 |
| 2022 | $3,138 | $364,850 | $0 | $0 |
| 2021 | $3,046 | $539,875 | $105,300 | $434,575 |
| 2020 | $2,459 | $410,746 | $105,300 | $305,446 |
| 2019 | $2,590 | $410,746 | $105,300 | $305,446 |
| 2018 | $2,206 | $346,840 | $80,400 | $266,440 |
| 2017 | $2,151 | $183,070 | $0 | $0 |
| 2016 | $2,183 | $183,070 | $0 | $0 |
| 2015 | $1,909 | $161,840 | $0 | $0 |
| 2014 | $1,860 | $161,840 | $0 | $0 |
| 2013 | -- | $164,600 | $0 | $0 |
Source: Public Records
Map
Nearby Homes
- 263 W 300 N
- 275 W 260 N
- 55 W 300 N
- 481 N 100 W
- 291 N Main St
- 1112 E 200 N
- 1153 E 200 N Unit 43
- 1137 E 200 N Unit 42
- 1138 E 200 N Unit 37
- 1124 E 200 N Unit 38
- 275 W 60 S
- 3700 U S 91
- 330 E 100 N
- 76 W 200 S
- 835 E 4100 N Unit 156
- 830 E 4100 N Unit 161
- 164 E 200 S
- 895 E 100 N Unit 11
- 813 S 380 E
- 219 E 830 S