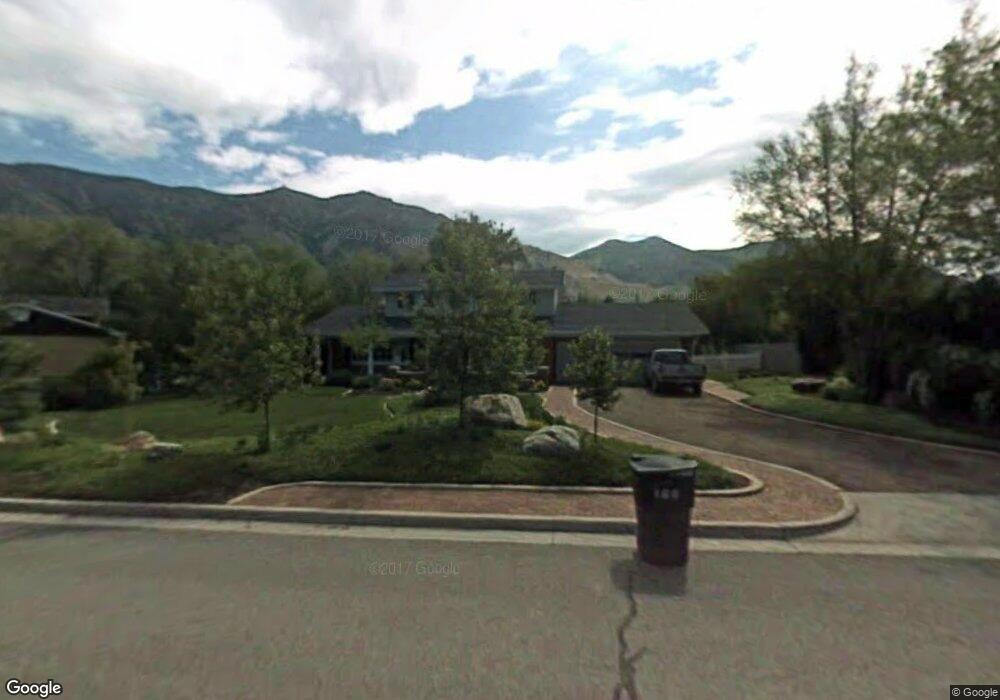
360 N 300 E Brigham City, UT 84302
Estimated Value: $545,000 - $684,715
5
Beds
4
Baths
4,715
Sq Ft
$135/Sq Ft
Est. Value
About This Home
This home is located at 360 N 300 E, Brigham City, UT 84302 and is currently estimated at $637,929, approximately $135 per square foot. 360 N 300 E is a home located in Box Elder County with nearby schools including Golden Spike Elementary, Box Elder Middle School, and Adele C. Young Intermediate School.
Ownership History
Date
Name
Owned For
Owner Type
Purchase Details
Closed on
Feb 24, 2010
Sold by
Valberg John E and Valberg Carol R
Bought by
Valberg John E and Valberg Carol R
Current Estimated Value
Create a Home Valuation Report for This Property
The Home Valuation Report is an in-depth analysis detailing your home's value as well as a comparison with similar homes in the area
Purchase History
| Date | Buyer | Sale Price | Title Company |
|---|---|---|---|
| Valberg John E | -- | -- |
Source: Public Records
Tax History Compared to Growth
Tax History
| Year | Tax Paid | Tax Assessment Tax Assessment Total Assessment is a certain percentage of the fair market value that is determined by local assessors to be the total taxable value of land and additions on the property. | Land | Improvement |
|---|---|---|---|---|
| 2025 | $3,812 | $655,522 | $105,000 | $550,522 |
| 2024 | $3,428 | $660,060 | $100,000 | $560,060 |
| 2023 | $3,748 | $738,843 | $95,000 | $643,843 |
| 2022 | $3,576 | $360,388 | $22,000 | $338,388 |
| 2021 | $3,007 | $448,409 | $40,000 | $408,409 |
| 2020 | $2,760 | $448,409 | $40,000 | $408,409 |
| 2019 | $2,554 | $220,783 | $22,000 | $198,783 |
| 2018 | $2,267 | $194,855 | $22,000 | $172,855 |
| 2017 | $2,101 | $312,644 | $16,500 | $282,644 |
| 2016 | $2,187 | $164,551 | $16,500 | $148,051 |
| 2015 | $1,996 | $151,092 | $16,500 | $134,592 |
| 2014 | $1,996 | $144,683 | $16,500 | $128,183 |
| 2013 | -- | $144,683 | $16,500 | $128,183 |
Source: Public Records
Map
Nearby Homes