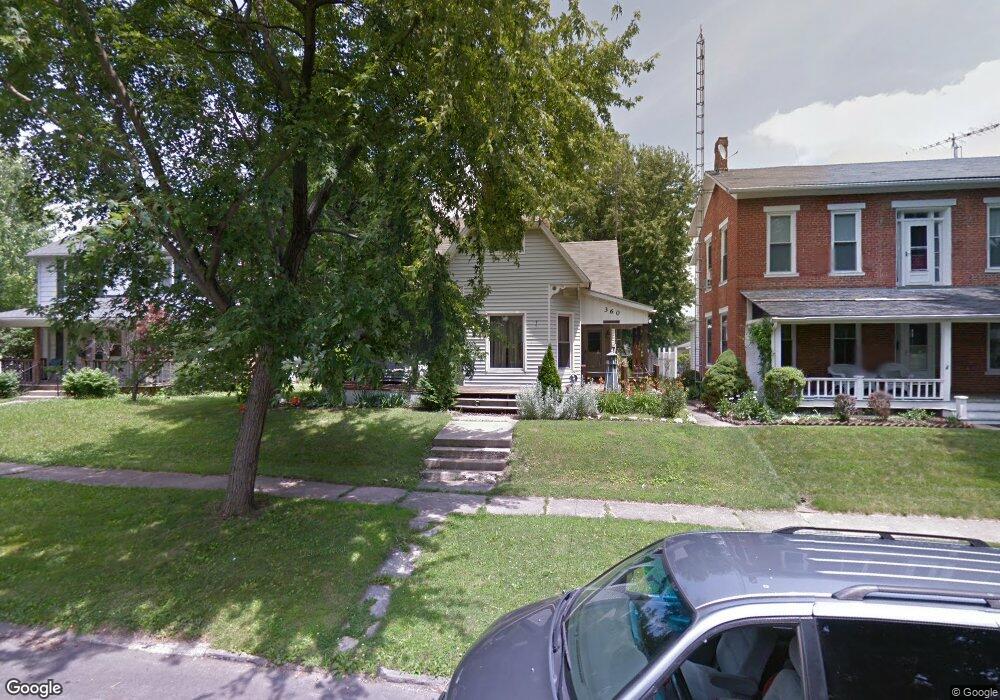
360 N Cherry St Kenton, OH 43326
Estimated Value: $121,000 - $146,000
3
Beds
1
Bath
1,715
Sq Ft
$80/Sq Ft
Est. Value
About This Home
This home is located at 360 N Cherry St, Kenton, OH 43326 and is currently estimated at $137,694, approximately $80 per square foot. 360 N Cherry St is a home located in Hardin County with nearby schools including Kenton Elementary School, Kenton Middle School, and Kenton High School.
Ownership History
Date
Name
Owned For
Owner Type
Purchase Details
Closed on
Aug 5, 2011
Sold by
Renftle William and Renftle Debra
Bought by
Renftle William
Current Estimated Value
Home Financials for this Owner
Home Financials are based on the most recent Mortgage that was taken out on this home.
Original Mortgage
$102,000
Outstanding Balance
$70,656
Interest Rate
4.58%
Mortgage Type
Reverse Mortgage Home Equity Conversion Mortgage
Estimated Equity
$67,038
Purchase Details
Closed on
Jul 2, 2009
Sold by
Wells Fargo Bank Na
Bought by
Renftle William and Renftle Debra
Purchase Details
Closed on
Jul 22, 2008
Sold by
Babcock Walter D and Babcock Kathleen
Bought by
Wells Fargo Bank Na
Purchase Details
Closed on
May 1, 1997
Bought by
Babcock Walter D and Babcock Kathl
Create a Home Valuation Report for This Property
The Home Valuation Report is an in-depth analysis detailing your home's value as well as a comparison with similar homes in the area
Home Values in the Area
Average Home Value in this Area
Purchase History
| Date | Buyer | Sale Price | Title Company |
|---|---|---|---|
| Renftle William | -- | None Available | |
| Renftle William | $25,000 | Mercantitle Center Building | |
| Wells Fargo Bank Na | $29,900 | None Available | |
| Babcock Walter D | $60,000 | -- |
Source: Public Records
Mortgage History
| Date | Status | Borrower | Loan Amount |
|---|---|---|---|
| Open | Renftle William | $102,000 |
Source: Public Records
Tax History
| Year | Tax Paid | Tax Assessment Tax Assessment Total Assessment is a certain percentage of the fair market value that is determined by local assessors to be the total taxable value of land and additions on the property. | Land | Improvement |
|---|---|---|---|---|
| 2024 | $950 | $31,850 | $2,110 | $29,740 |
| 2023 | $971 | $31,850 | $2,110 | $29,740 |
| 2022 | $1,178 | $33,990 | $1,590 | $32,400 |
| 2021 | $1,182 | $33,990 | $1,590 | $32,400 |
| 2020 | $1,128 | $33,990 | $1,590 | $32,400 |
| 2019 | $898 | $28,020 | $1,510 | $26,510 |
| 2018 | $875 | $28,020 | $1,510 | $26,510 |
| 2017 | $862 | $28,020 | $1,510 | $26,510 |
| 2016 | $690 | $24,170 | $2,140 | $22,030 |
| 2015 | $868 | $24,170 | $2,140 | $22,030 |
| 2014 | $101 | $24,170 | $2,140 | $22,030 |
| 2013 | $715 | $25,480 | $2,140 | $23,340 |
Source: Public Records
Map
Nearby Homes
- 0 N Barron St Unit Lot 6
- 0 N Barron St Unit Lot 8
- 0 N Barron St Unit Lot 3
- 0 N Barron St Unit Lot 2
- 0 N Barron St Unit Lot 4
- 503 Jennings St Unit Lot 7
- 405 E Carrol St Unit 405 1/2
- 416 E Eliza St Unit Lot 1
- 509 E North St
- 405 E Carroll St
- 411 E Eliza St
- 233 N Main St
- 619 E North St
- 310 N Market St
- 0 Gilmore St Unit Lot 9
- 0 Gilmore St Unit Lot 10
- 690 N High St
- 219 W Carrol St
- 120 Oak Ln Unit 7
- 299 Marie Ave
Your Personal Tour Guide
Ask me questions while you tour the home.