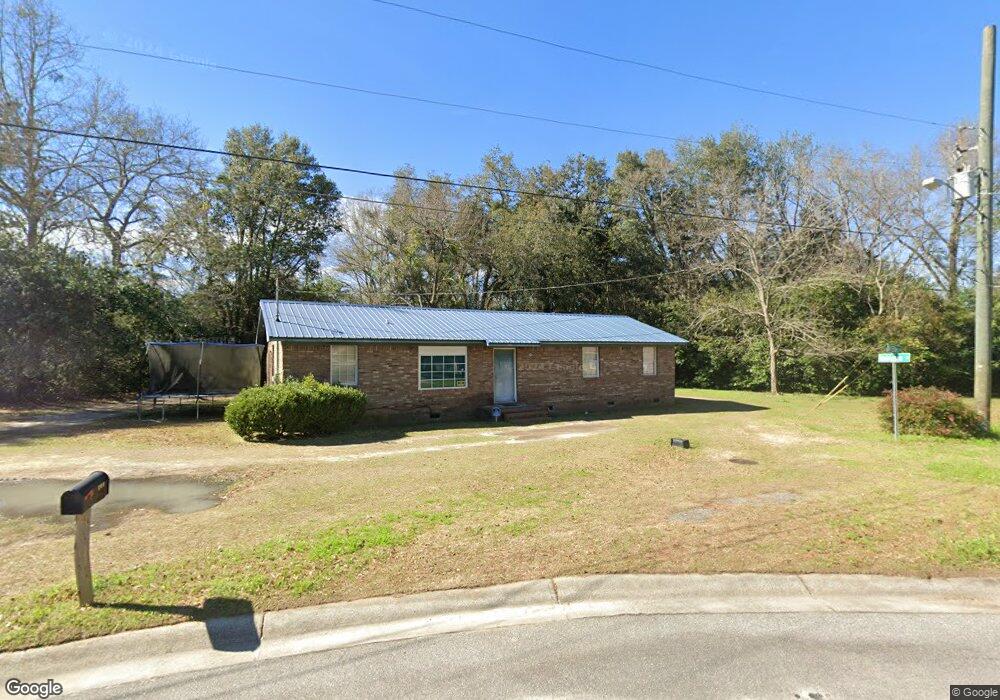
360 N Ellis St Camilla, GA 31730
Estimated Value: $84,000 - $111,000
--
Bed
1
Bath
1,400
Sq Ft
$70/Sq Ft
Est. Value
About This Home
This home is located at 360 N Ellis St, Camilla, GA 31730 and is currently estimated at $97,665, approximately $69 per square foot. 360 N Ellis St is a home located in Mitchell County with nearby schools including Mitchell County Primary School, Mitchell County Elementary School, and Mitchell County Middle School.
Ownership History
Date
Name
Owned For
Owner Type
Purchase Details
Closed on
Jul 12, 2007
Sold by
United National Bank
Bought by
Williams Lee H
Current Estimated Value
Home Financials for this Owner
Home Financials are based on the most recent Mortgage that was taken out on this home.
Original Mortgage
$85,600
Outstanding Balance
$60,526
Interest Rate
6.71%
Mortgage Type
New Conventional
Estimated Equity
$37,139
Purchase Details
Closed on
Mar 28, 2007
Sold by
Lee H Williams Construction
Bought by
Williams Lee H
Purchase Details
Closed on
Nov 7, 2006
Sold by
Usda Rural Development
Bought by
Lee H Williams Construction Co
Purchase Details
Closed on
Mar 15, 2005
Sold by
Lee H Williams Properties
Bought by
Simpson Quinton
Home Financials for this Owner
Home Financials are based on the most recent Mortgage that was taken out on this home.
Original Mortgage
$73,000
Interest Rate
5.57%
Mortgage Type
New Conventional
Create a Home Valuation Report for This Property
The Home Valuation Report is an in-depth analysis detailing your home's value as well as a comparison with similar homes in the area
Home Values in the Area
Average Home Value in this Area
Purchase History
| Date | Buyer | Sale Price | Title Company |
|---|---|---|---|
| Williams Lee H | -- | -- | |
| Lamons April S | $86,000 | -- | |
| Williams Lee H | $60,000 | -- | |
| Lee H Williams Construction Co | $56,503 | -- | |
| Simpson Quinton | $73,000 | -- |
Source: Public Records
Mortgage History
| Date | Status | Borrower | Loan Amount |
|---|---|---|---|
| Open | Williams Lee H | $85,600 | |
| Previous Owner | Simpson Quinton | $73,000 |
Source: Public Records
Tax History Compared to Growth
Tax History
| Year | Tax Paid | Tax Assessment Tax Assessment Total Assessment is a certain percentage of the fair market value that is determined by local assessors to be the total taxable value of land and additions on the property. | Land | Improvement |
|---|---|---|---|---|
| 2024 | $1,197 | $30,480 | $2,160 | $28,320 |
| 2023 | $1,281 | $30,480 | $2,160 | $28,320 |
| 2022 | $985 | $23,440 | $2,160 | $21,280 |
| 2021 | $854 | $20,320 | $2,160 | $18,160 |
| 2020 | $854 | $20,320 | $2,160 | $18,160 |
| 2019 | $842 | $20,120 | $2,160 | $17,960 |
| 2018 | $878 | $20,120 | $2,160 | $17,960 |
| 2017 | $1,106 | $25,600 | $1,762 | $23,838 |
| 2016 | $1,092 | $25,600 | $1,762 | $23,838 |
| 2015 | $1,092 | $25,600 | $1,762 | $23,838 |
| 2014 | $1,092 | $25,600 | $1,762 | $23,838 |
| 2013 | $1,092 | $25,600 | $1,762 | $23,837 |
Source: Public Records
Map
Nearby Homes
- 343 Wilson St
- 40 Beacon St
- 175 N Harney St
- 208 E Church St
- 75 Newton St
- 69 Newton St
- 15 E Church St
- 25 Hilltop Cir
- 87 Newton St
- 0 Butler St
- 7 S Macarthur Dr
- 70 S Butler St
- HWY 19 U S Highway 19
- 000 U S Highway 19
- 200 U S Highway 19
- 200 U S 19
- 4146 Old Ga Hwy 3
- 295 Brimberry St
- 107 Morningside Dr
- 31 Cedar Ln