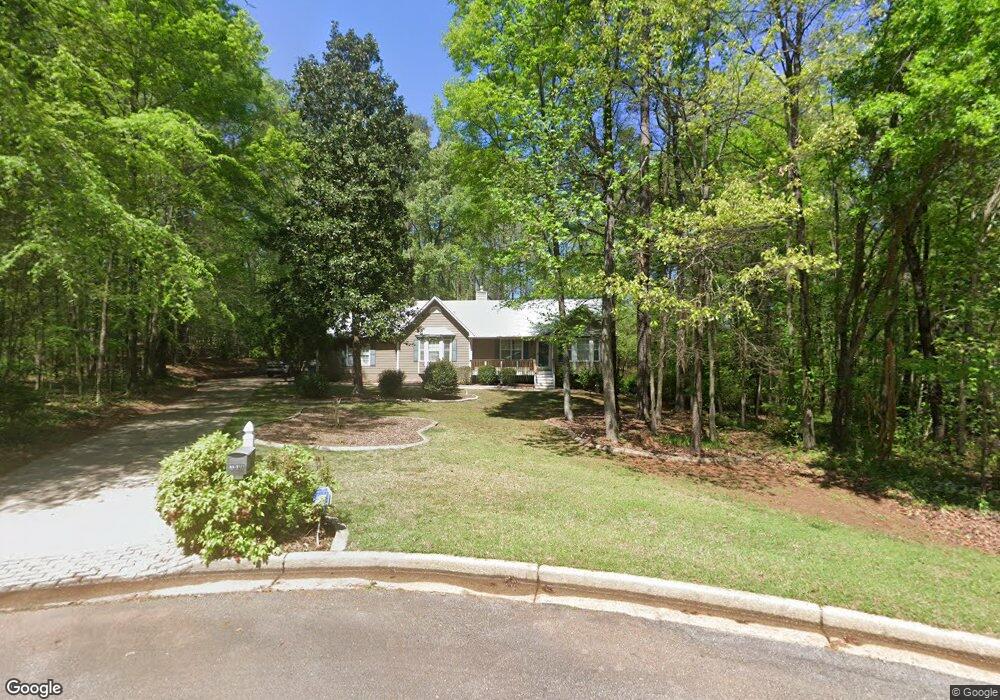
360 N Grove Ct McDonough, GA 30252
Estimated Value: $284,737 - $327,000
3
Beds
2
Baths
1,632
Sq Ft
$187/Sq Ft
Est. Value
About This Home
This home is located at 360 N Grove Ct, McDonough, GA 30252 and is currently estimated at $304,684, approximately $186 per square foot. 360 N Grove Ct is a home located in Henry County with nearby schools including Pleasant Grove Elementary School, Woodland Middle School, and Woodland High School.
Ownership History
Date
Name
Owned For
Owner Type
Purchase Details
Closed on
Aug 26, 2002
Sold by
Thomas Angela M
Bought by
Rigsbee Angela M and Rigsbee Ronald G
Current Estimated Value
Home Financials for this Owner
Home Financials are based on the most recent Mortgage that was taken out on this home.
Original Mortgage
$115,000
Interest Rate
6.4%
Mortgage Type
New Conventional
Purchase Details
Closed on
Feb 21, 1997
Sold by
Czander Greg Pamela
Bought by
Thomas Angela and Rigsbee Ronald
Purchase Details
Closed on
Jun 10, 1993
Sold by
Collins Construction
Bought by
Czander Greg A and Czander Pamela M
Home Financials for this Owner
Home Financials are based on the most recent Mortgage that was taken out on this home.
Original Mortgage
$103,412
Interest Rate
7.44%
Mortgage Type
FHA
Create a Home Valuation Report for This Property
The Home Valuation Report is an in-depth analysis detailing your home's value as well as a comparison with similar homes in the area
Home Values in the Area
Average Home Value in this Area
Purchase History
| Date | Buyer | Sale Price | Title Company |
|---|---|---|---|
| Rigsbee Angela M | -- | -- | |
| Thomas Angela | $126,900 | -- | |
| Czander Greg A | $105,300 | -- |
Source: Public Records
Mortgage History
| Date | Status | Borrower | Loan Amount |
|---|---|---|---|
| Closed | Rigsbee Angela M | $115,000 | |
| Previous Owner | Czander Greg A | $103,412 | |
| Closed | Thomas Angela | $0 |
Source: Public Records
Tax History Compared to Growth
Tax History
| Year | Tax Paid | Tax Assessment Tax Assessment Total Assessment is a certain percentage of the fair market value that is determined by local assessors to be the total taxable value of land and additions on the property. | Land | Improvement |
|---|---|---|---|---|
| 2025 | $2,940 | $118,604 | $16,000 | $102,604 |
| 2024 | $2,940 | $110,080 | $16,000 | $94,080 |
| 2023 | $2,591 | $106,120 | $12,000 | $94,120 |
| 2022 | $2,864 | $96,320 | $12,000 | $84,320 |
| 2021 | $2,619 | $85,920 | $12,000 | $73,920 |
| 2020 | $2,486 | $80,320 | $10,800 | $69,520 |
| 2019 | $2,271 | $71,200 | $10,800 | $60,400 |
| 2018 | $2,174 | $67,120 | $10,000 | $57,120 |
| 2016 | $1,678 | $49,760 | $8,800 | $40,960 |
| 2015 | $1,444 | $42,800 | $7,200 | $35,600 |
| 2014 | $1,290 | $38,600 | $7,200 | $31,400 |
Source: Public Records
Map
Nearby Homes
- 1404 Lancaster Ct
- 450 Kelleytown Rd
- 310 Pleasant Grove Rd
- 136 Asa Moseley Rd
- 142 Asa Moseley Rd
- 148 Asa Moseley Rd
- 150 Asa Moseley Rd
- 0 Asa Moseley Rd
- 312 Dovehouse St
- 145 Asa Mosley Rd
- 96 Ashtonbrook Dr
- 108 Ashtonbrook Dr
- 3669 E Fairview Rd
- 1307 Regatta Way
- 349 Asa Moseley Rd
- 711 Forestglen Dr
- 501 Wedgepark Dr Unit 4
- 30 Roseberry Dr
- 2983 E Fairview Rd
- 119 Camp Creek Dr
- 350 N Grove Ct
- 355 N Grove Ct
- 1217 Catalina Pkwy
- 345 N Grove Ct
- 495 Kelleytown Woods Pkwy
- 494 Kelleytown Woods Pkwy
- 1219 Catalina Pkwy
- 340 N Grove Ct
- 335 N Grove Ct
- 491 Kelleytown Woods Pkwy
- 1213 Catalina Pkwy
- 260 Pleasant Grove Cir
- 490 Kelleytown Woods Pkwy
- 270 Pleasant Grove Cir
- 250 Pleasant Grove Cir
- 0 Lancaster Ct Unit 7284923
- 0 Lancaster Ct Unit 7003981
- 0 Lancaster Ct Unit 3056981
- 1216 Catalina Pkwy
- 280 Pleasant Grove Cir