Estimated Value: $298,000 - $523,000
3
Beds
3
Baths
1,440
Sq Ft
$292/Sq Ft
Est. Value
About This Home
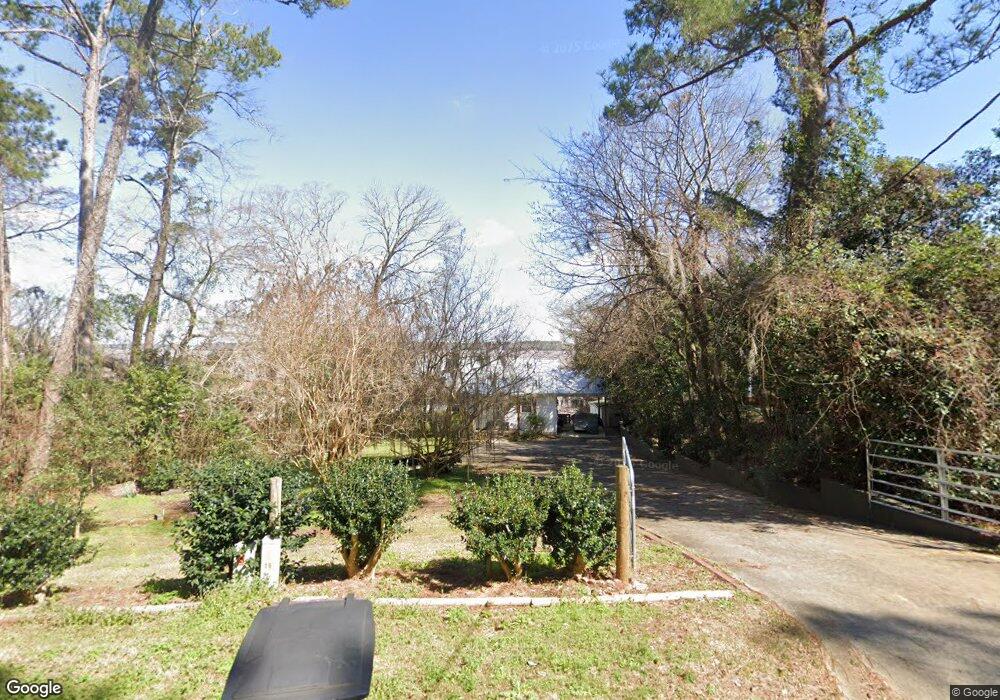
This home is located at 360 N Spring Creek Cir, Cobb, GA 31735 and is currently estimated at $421,038, approximately $292 per square foot. 360 N Spring Creek Cir is a home located in Sumter County with nearby schools including Sumter County Primary School, Sumter County Elementary School, and Sumter County Middle School.
Ownership History
Date
Name
Owned For
Owner Type
Purchase Details
Closed on
Dec 23, 2009
Sold by
Elder Michael J
Bought by
Elder Michael J and Hairston Sally M
Current Estimated Value
Purchase Details
Closed on
Sep 26, 2002
Sold by
Sholar Wallace E
Bought by
Elder Michael J
Purchase Details
Closed on
Aug 31, 1998
Sold by
Cummins Daniel H
Bought by
Sholar Wallace E
Purchase Details
Closed on
Sep 26, 1996
Sold by
Cummins Daniel H
Bought by
Cummins Daniel H
Purchase Details
Closed on
Jan 1, 1986
Sold by
Goff W D
Bought by
Cummins Daniel H
Purchase Details
Closed on
Feb 24, 1981
Sold by
Noble Bobby E
Bought by
Goff W D
Purchase Details
Closed on
Nov 16, 1976
Bought by
Noble Bobby E
Create a Home Valuation Report for This Property
The Home Valuation Report is an in-depth analysis detailing your home's value as well as a comparison with similar homes in the area
Home Values in the Area
Average Home Value in this Area
Purchase History
| Date | Buyer | Sale Price | Title Company |
|---|---|---|---|
| Elder Michael J | -- | -- | |
| Elder Michael J | $155,000 | -- | |
| Sholar Wallace E | $124,900 | -- | |
| Cummins Daniel H | -- | -- | |
| Cummins Daniel H | $47,000 | -- | |
| Goff W D | $7,000 | -- | |
| Noble Bobby E | $11,000 | -- |
Source: Public Records
Tax History Compared to Growth
Tax History
| Year | Tax Paid | Tax Assessment Tax Assessment Total Assessment is a certain percentage of the fair market value that is determined by local assessors to be the total taxable value of land and additions on the property. | Land | Improvement |
|---|---|---|---|---|
| 2024 | $3,590 | $100,124 | $51,960 | $48,164 |
| 2023 | $3,491 | $100,124 | $51,960 | $48,164 |
| 2022 | $3,491 | $100,124 | $51,960 | $48,164 |
| 2021 | $3,498 | $100,124 | $51,960 | $48,164 |
| 2020 | $2,212 | $2,120 | $0 | $2,120 |
| 2019 | $2,193 | $2,120 | $0 | $2,120 |
| 2018 | $2,994 | $82,804 | $51,960 | $30,844 |
| 2017 | $2,994 | $82,804 | $51,960 | $30,844 |
| 2016 | $2,997 | $82,804 | $51,960 | $30,844 |
| 2015 | $2,741 | $76,324 | $38,960 | $37,364 |
| 2014 | -- | $76,324 | $38,960 | $37,364 |
Source: Public Records
Map
Nearby Homes
- 0 N Spring Creek Cir
- TBD N Spring Creek Cir
- 108 N Spring Creek Cir
- 252 N Spring Creek Cir
- 113 Cypress Ln
- 115 Cypress Ln
- 114 Water Front Rd
- 170D Cantey Dr
- 152 Cantey Dr
- 101 Rose Ln
- 151 Gary Brewer Rd
- TBD Sawdust Trail
- 244 Cannon Branch Rd
- 100 Valhalla
- 154 Cannon Branch Rd
- Lot # 18 Cannon Branch Rd
- Lot #35 Cannon Branch Rd
- Lot #32 Cannon Branch Rd
- Lot # 30 Cannon Branch Rd
- Lot # 17 Cannon Branch Rd
- 358 N Spring Creek Cir
- 368 N Spring Creek Cir
- 370 N Spring Creek Cir
- 352 N Spring Creek Cir
- 350 N Spring Creek Cir
- 374 N Spring Creek Cir
- 344 N Spring Creek Cir
- 376 N Spring Creek Cir Unit .25
- 377 N Spring Creek Cir
- 382 S Spring Creek Creek
- SS N Spring Creek Cir
- Yyy N Spring Creek Cir
- Xxx N Spring Creek Cir
- Lot 5 N Spring Creek Cir
- Tract B N Spring Creek Cir
- Tract A N Spring Creek Cir
- Tract C N Spring Creek Cir
- N N Spring Creek Cir
- 334 N Spring Creek Cir
- 384 N Spring Creek Cir