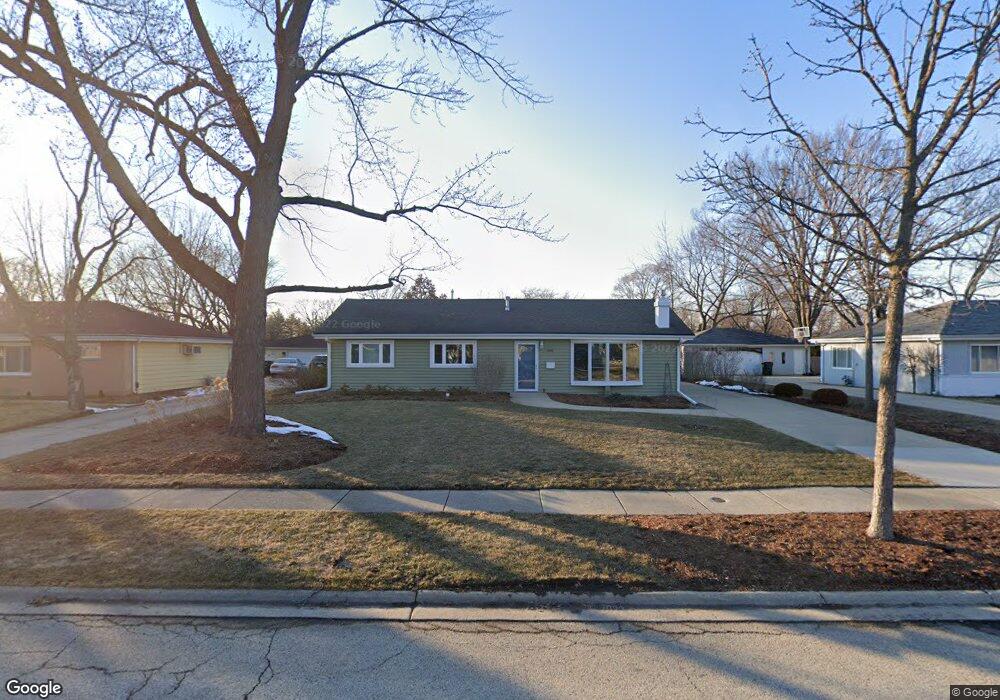
360 Newton St Hoffman Estates, IL 60169
South Hoffman Estates NeighborhoodEstimated Value: $343,109 - $374,000
3
Beds
1
Bath
1,229
Sq Ft
$294/Sq Ft
Est. Value
About This Home
This home is located at 360 Newton St, Hoffman Estates, IL 60169 and is currently estimated at $361,027, approximately $293 per square foot. 360 Newton St is a home located in Cook County with nearby schools including Lakeview Elementary School, Helen Keller Junior High School, and Schaumburg High School.
Ownership History
Date
Name
Owned For
Owner Type
Purchase Details
Closed on
Aug 25, 2021
Sold by
Fuglestad David and Fuglestad Patricia
Bought by
Fuglestad David A and Fuglestad Patricia M
Current Estimated Value
Purchase Details
Closed on
Mar 23, 2008
Sold by
Fuglestad Anne and Fuglestad David
Bought by
Fuglestad Patricia and Fuglestad David
Purchase Details
Closed on
Aug 29, 1997
Sold by
Mikesell Randy I and Mikesell Anabel J
Bought by
Fugelstad Dave and Fugelstad Arne
Home Financials for this Owner
Home Financials are based on the most recent Mortgage that was taken out on this home.
Original Mortgage
$104,400
Interest Rate
7.54%
Purchase Details
Closed on
Dec 28, 1994
Sold by
Phelan Patrick W
Bought by
Mikesell Randy L and Mikesell Anabel J
Home Financials for this Owner
Home Financials are based on the most recent Mortgage that was taken out on this home.
Original Mortgage
$117,800
Interest Rate
9.24%
Purchase Details
Closed on
Oct 30, 1993
Sold by
Phelan Rita A
Bought by
Phelan Rita A
Create a Home Valuation Report for This Property
The Home Valuation Report is an in-depth analysis detailing your home's value as well as a comparison with similar homes in the area
Home Values in the Area
Average Home Value in this Area
Purchase History
| Date | Buyer | Sale Price | Title Company |
|---|---|---|---|
| Fuglestad David A | -- | Attorney | |
| Fuglestad Patricia | -- | None Available | |
| Fugelstad Dave | $87,000 | Lawyers Title Insurance Corp | |
| Mikesell Randy L | $124,000 | -- | |
| Phelan Rita A | -- | -- |
Source: Public Records
Mortgage History
| Date | Status | Borrower | Loan Amount |
|---|---|---|---|
| Previous Owner | Fugelstad Dave | $104,400 | |
| Previous Owner | Mikesell Randy L | $117,800 |
Source: Public Records
Tax History Compared to Growth
Tax History
| Year | Tax Paid | Tax Assessment Tax Assessment Total Assessment is a certain percentage of the fair market value that is determined by local assessors to be the total taxable value of land and additions on the property. | Land | Improvement |
|---|---|---|---|---|
| 2024 | $5,616 | $22,278 | $6,006 | $16,272 |
| 2023 | $6,022 | $24,380 | $6,006 | $18,374 |
| 2022 | $6,022 | $24,380 | $6,006 | $18,374 |
| 2021 | $4,734 | $18,125 | $4,254 | $13,871 |
| 2020 | $4,713 | $18,125 | $4,254 | $13,871 |
| 2019 | $4,758 | $20,366 | $4,254 | $16,112 |
| 2018 | $4,460 | $17,112 | $3,753 | $13,359 |
| 2017 | $4,399 | $17,112 | $3,753 | $13,359 |
| 2016 | $4,354 | $17,112 | $3,753 | $13,359 |
| 2015 | $3,143 | $12,409 | $3,253 | $9,156 |
| 2014 | $3,105 | $12,409 | $3,253 | $9,156 |
| 2013 | $3,812 | $15,027 | $3,253 | $11,774 |
Source: Public Records
Map
Nearby Homes
- 455 Mohave St
- 480 Illinois Blvd
- 313 Lincoln St
- 510 Milan Ln
- 585 Newark Ln
- 320 Pleasant St
- 365 Washington Blvd
- 645 Maywood Ln
- 21 White Pine Dr
- 13 Sarahs Grove Ln
- 32 Hilltop Dr
- 100 Des Plaines Ln
- 153 Fulbright Ln
- 11 Stone Bridge Ct
- 370 Flagstaff Ln
- 147 Fulbright Ln
- 565 Flagstaff Ln
- 12 Stone Bridge Ct
- 221 Grissom Ln
- 225 Barcliffe Ln Unit 1011
- 350 Newton St
- 370 Newton St
- 379 Illinois Blvd
- 375 Illinois Blvd
- 340 Newton St
- 380 Newton St
- 355 Navajo Ln
- 365 Illinois Blvd
- 391 Illinois Blvd
- 340 Navajo Ln
- 390 Newton St
- 330 Newton St
- 345 Newton St
- 355 Illinois Blvd
- 395 Illinois Blvd
- 345 Navajo Ln
- 391 Newton St
- 325 Newton St
- 370 Illinois Blvd
- 310 Navajo Ln