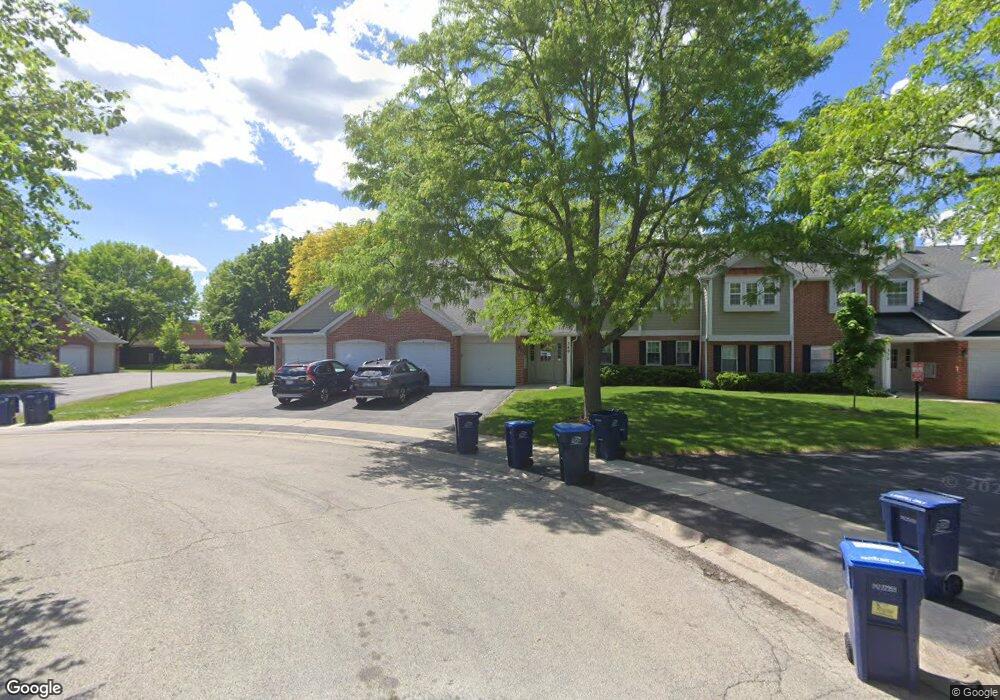
360 Pembroke Ct Unit 17254 Schaumburg, IL 60193
West Schaumburg NeighborhoodEstimated Value: $265,158 - $277,000
2
Beds
--
Bath
--
Sq Ft
17.51
Acres
About This Home
This home is located at 360 Pembroke Ct Unit 17254, Schaumburg, IL 60193 and is currently estimated at $272,790. 360 Pembroke Ct Unit 17254 is a home located in Cook County with nearby schools including Albert Einstein Elementary School, Jane Addams Junior High School, and Hoffman Estates High School.
Ownership History
Date
Name
Owned For
Owner Type
Purchase Details
Closed on
Oct 30, 2002
Sold by
Egolf Vincent S
Bought by
Peszynski Michael R
Current Estimated Value
Home Financials for this Owner
Home Financials are based on the most recent Mortgage that was taken out on this home.
Original Mortgage
$140,000
Interest Rate
6.13%
Purchase Details
Closed on
Jan 8, 1998
Sold by
Walker Eleanore F and Hartman Joseph T
Bought by
Egolf Vincent S
Home Financials for this Owner
Home Financials are based on the most recent Mortgage that was taken out on this home.
Original Mortgage
$98,300
Interest Rate
7.24%
Purchase Details
Closed on
Jan 6, 1997
Sold by
Hall John W
Bought by
Walker Eleanore P and Hartman Joseph T
Purchase Details
Closed on
May 13, 1994
Sold by
Ensink Robert A
Bought by
Hall John W
Home Financials for this Owner
Home Financials are based on the most recent Mortgage that was taken out on this home.
Original Mortgage
$86,850
Interest Rate
8.5%
Create a Home Valuation Report for This Property
The Home Valuation Report is an in-depth analysis detailing your home's value as well as a comparison with similar homes in the area
Home Values in the Area
Average Home Value in this Area
Purchase History
| Date | Buyer | Sale Price | Title Company |
|---|---|---|---|
| Peszynski Michael R | $151,000 | Atgf Inc | |
| Egolf Vincent S | $103,500 | -- | |
| Walker Eleanore P | $104,500 | Prairie Title | |
| Hall John W | $96,500 | -- |
Source: Public Records
Mortgage History
| Date | Status | Borrower | Loan Amount |
|---|---|---|---|
| Previous Owner | Peszynski Michael R | $140,000 | |
| Previous Owner | Egolf Vincent S | $98,300 | |
| Previous Owner | Hall John W | $86,850 |
Source: Public Records
Tax History Compared to Growth
Tax History
| Year | Tax Paid | Tax Assessment Tax Assessment Total Assessment is a certain percentage of the fair market value that is determined by local assessors to be the total taxable value of land and additions on the property. | Land | Improvement |
|---|---|---|---|---|
| 2024 | $3,602 | $16,176 | $2,982 | $13,194 |
| 2023 | $3,465 | $16,176 | $2,982 | $13,194 |
| 2022 | $3,465 | $16,176 | $2,982 | $13,194 |
| 2021 | $3,117 | $13,615 | $2,040 | $11,575 |
| 2020 | $3,132 | $13,615 | $2,040 | $11,575 |
| 2019 | $3,157 | $15,207 | $2,040 | $13,167 |
| 2018 | $2,383 | $11,377 | $1,647 | $9,730 |
| 2017 | $2,364 | $11,377 | $1,647 | $9,730 |
| 2016 | $2,453 | $11,377 | $1,647 | $9,730 |
| 2015 | $2,141 | $9,781 | $1,490 | $8,291 |
| 2014 | $2,134 | $9,781 | $1,490 | $8,291 |
| 2013 | $2,062 | $9,781 | $1,490 | $8,291 |
Source: Public Records
Map
Nearby Homes
- 200 Columbia Ct Unit 5
- 224 Glenridge Ln
- 8138 N Carrolton Ct
- 2404 Baldwin Ct
- 2902 Belle Ln
- 2868 Belle Ln Unit 143B28
- 195 Island Ct
- 7873 Asbury Cir S
- 136 Caryville Ln
- 2814 Belle Ln Unit 128A28
- 1316 Kingsbury Dr Unit 1
- 7843 Kensington Ln
- 1323 Kingsbury Dr Unit 2
- 1307 Kingsbury Dr Unit A
- 515 Southwood Cir
- 2317 Broadway Ln
- 171 Sierra Pass Dr Unit 261713
- 7526 Bristol Ln Unit 502
- 7523 Bristol Ln Unit A
- 133 White Branch Ct S Unit 539
- 360 Pembroke Ct Unit 17252
- 360 Pembroke Ct Unit 17251
- 360 Pembroke Ct Unit 17253
- 352 Pembroke Ct Unit 7
- 352 Pembroke Ct Unit 17257
- 352 Pembroke Ct Unit 17256
- 352 Pembroke Ct Unit 17258
- 352 Pembroke Ct Unit 17255
- 352 Pembroke Ct Unit 5
- 352 Pembroke Ct Unit 8
- 352 Pembroke Ct Unit D
- 361 Pembroke Ct Unit 6
- 361 Pembroke Ct Unit 17246
- 361 Pembroke Ct Unit 17248
- 361 Pembroke Ct Unit 17247
- 361 Pembroke Ct Unit 17245
- 361 Pembroke Ct Unit 8
- 361 Pembroke Ct Unit 5
- 344 Pembroke Ct Unit 17263
- 344 Pembroke Ct Unit 17264