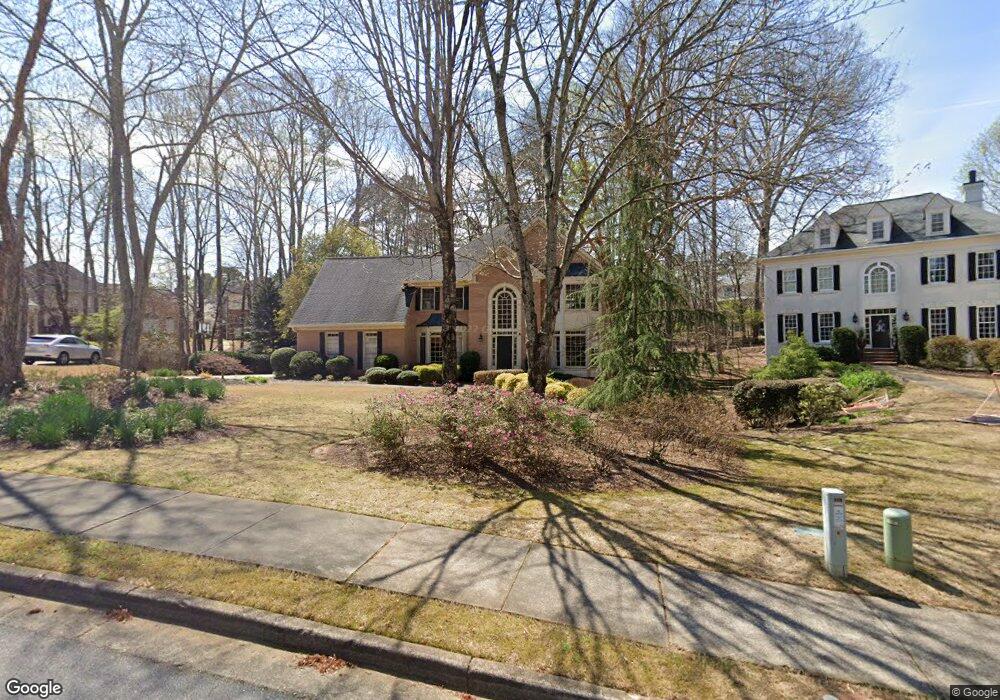
360 Pilgrimage Point Alpharetta, GA 30022
Estimated Value: $942,461 - $1,098,000
5
Beds
5
Baths
3,850
Sq Ft
$263/Sq Ft
Est. Value
About This Home
This home is located at 360 Pilgrimage Point, Alpharetta, GA 30022 and is currently estimated at $1,011,615, approximately $262 per square foot. 360 Pilgrimage Point is a home located in Fulton County with nearby schools including Dolvin Elementary School, Autrey Mill Middle School, and Johns Creek High School.
Ownership History
Date
Name
Owned For
Owner Type
Purchase Details
Closed on
Jun 17, 2008
Sold by
Border William L
Bought by
Border William L and Border Jacqueline
Current Estimated Value
Home Financials for this Owner
Home Financials are based on the most recent Mortgage that was taken out on this home.
Original Mortgage
$91,450
Interest Rate
5.96%
Mortgage Type
Unknown
Purchase Details
Closed on
Jun 16, 1998
Sold by
Rogers Bryan S and Rogers Marian H
Bought by
Pound John G and Pound Mary K
Home Financials for this Owner
Home Financials are based on the most recent Mortgage that was taken out on this home.
Original Mortgage
$277,600
Interest Rate
6.5%
Mortgage Type
New Conventional
Purchase Details
Closed on
May 2, 1996
Sold by
Lewi S Newman Inc
Bought by
Rogers Bryan S Marian H
Create a Home Valuation Report for This Property
The Home Valuation Report is an in-depth analysis detailing your home's value as well as a comparison with similar homes in the area
Home Values in the Area
Average Home Value in this Area
Purchase History
| Date | Buyer | Sale Price | Title Company |
|---|---|---|---|
| Border William L | -- | -- | |
| Border William L | $565,000 | -- | |
| Dodge N P | $565,000 | -- | |
| Pound John G | $247,000 | -- | |
| Rogers Bryan S Marian H | $303,500 | -- |
Source: Public Records
Mortgage History
| Date | Status | Borrower | Loan Amount |
|---|---|---|---|
| Closed | Dodge N P | $91,450 | |
| Closed | Dodge N P | $91,450 | |
| Open | Dodge N P | $417,000 | |
| Previous Owner | Pound John G | $277,600 | |
| Closed | Rogers Bryan S Marian H | $0 |
Source: Public Records
Tax History Compared to Growth
Tax History
| Year | Tax Paid | Tax Assessment Tax Assessment Total Assessment is a certain percentage of the fair market value that is determined by local assessors to be the total taxable value of land and additions on the property. | Land | Improvement |
|---|---|---|---|---|
| 2025 | $1,237 | $374,320 | $90,160 | $284,160 |
| 2023 | $7,639 | $270,640 | $52,440 | $218,200 |
| 2022 | $5,699 | $240,280 | $55,640 | $184,640 |
| 2021 | $6,746 | $240,800 | $58,280 | $182,520 |
| 2020 | $6,795 | $240,680 | $69,320 | $171,360 |
| 2019 | $1,048 | $236,440 | $68,080 | $168,360 |
| 2018 | $5,625 | $211,400 | $50,920 | $160,480 |
| 2017 | $5,582 | $203,280 | $48,960 | $154,320 |
| 2016 | $5,520 | $201,160 | $48,960 | $152,200 |
| 2015 | $6,499 | $201,160 | $48,960 | $152,200 |
| 2014 | $5,289 | $185,280 | $53,800 | $131,480 |
Source: Public Records
Map
Nearby Homes
- 120 Thome Dr
- 10415 Plantation Bridge Dr
- 125 Oak Bridge Ct Unit 2
- 415 Wood Trace Ct
- 10515 Colony Glen Dr Unit 2
- 235 Wood Shoals Ct
- 710 Country Manor Way
- 130 Colony Run
- 9925 Lauren Hall Ct
- 10050 Lauren Hall Ct
- 10405 Meadow Crest Ln
- 10530 Tuxford Dr
- 125 Sandridge Ct
- 610 Varina Way
- 825 Highland Bend Cove
- 115 Thome Dr
- 10090 Jones Bridge Rd Unit 8
- 285 Rolling Mist Ct
- 10880 Windham Way
- 370 Pilgrimage Point
- 350 Pilgrimage Point
- 355 Pilgrimage Point Unit 4
- 345 Pilgrimage Point
- 380 Pilgrimage Point Unit IV
- 10825 Centennial Dr
- 340 Pilgrimage Point
- 735 Waterview Trail
- 745 Waterview Trail
- 725 Waterview Trail
- 335 Pilgrimage Point
- 10835 Centennial Dr
- 365 Pilgrimage Point Unit 4
- 375 Pilgrimage Point
- 715 Waterview Trail
- 220 Centennial Dr Unit 53
- 330 Pilgrimage Point
- 710 Waterview Trail
- 325 Constantine Close Unit 2B
- 325 Pilgrimage Point Unit 4