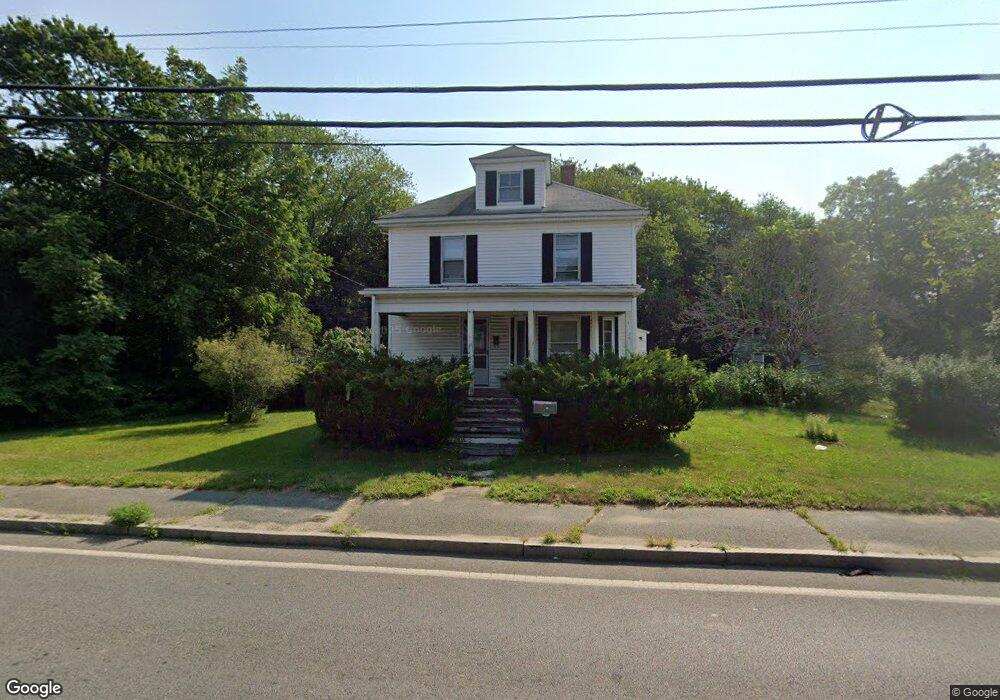
360 Quincy St Brockton, MA 02302
Estimated Value: $521,000 - $560,000
4
Beds
1
Bath
1,795
Sq Ft
$302/Sq Ft
Est. Value
About This Home
This home is located at 360 Quincy St, Brockton, MA 02302 and is currently estimated at $541,221, approximately $301 per square foot. 360 Quincy St is a home located in Plymouth County with nearby schools including Brookfield Elementary School, Downey Elementary School, and Ashfield Middle School.
Ownership History
Date
Name
Owned For
Owner Type
Purchase Details
Closed on
Feb 14, 1992
Sold by
Mickiewicz Stephanie
Bought by
Mickiewicz Vincent E and Edwards Helen H
Current Estimated Value
Home Financials for this Owner
Home Financials are based on the most recent Mortgage that was taken out on this home.
Original Mortgage
$80,000
Interest Rate
8.18%
Mortgage Type
Purchase Money Mortgage
Create a Home Valuation Report for This Property
The Home Valuation Report is an in-depth analysis detailing your home's value as well as a comparison with similar homes in the area
Home Values in the Area
Average Home Value in this Area
Purchase History
| Date | Buyer | Sale Price | Title Company |
|---|---|---|---|
| Mickiewicz Vincent E | $125,000 | -- |
Source: Public Records
Mortgage History
| Date | Status | Borrower | Loan Amount |
|---|---|---|---|
| Closed | Mickiewicz Vincent E | $80,000 |
Source: Public Records
Tax History Compared to Growth
Tax History
| Year | Tax Paid | Tax Assessment Tax Assessment Total Assessment is a certain percentage of the fair market value that is determined by local assessors to be the total taxable value of land and additions on the property. | Land | Improvement |
|---|---|---|---|---|
| 2025 | $5,648 | $466,400 | $173,400 | $293,000 |
| 2024 | $5,327 | $443,200 | $173,400 | $269,800 |
| 2023 | $5,110 | $393,700 | $138,800 | $254,900 |
| 2022 | $5,091 | $364,400 | $127,400 | $237,000 |
| 2021 | $4,685 | $323,100 | $114,700 | $208,400 |
| 2020 | $4,531 | $299,100 | $109,700 | $189,400 |
| 2019 | $4,440 | $285,700 | $102,200 | $183,500 |
| 2018 | $4,025 | $250,600 | $102,200 | $148,400 |
| 2017 | $3,885 | $241,300 | $102,200 | $139,100 |
| 2016 | $3,536 | $203,700 | $99,500 | $104,200 |
| 2015 | $3,474 | $191,400 | $99,500 | $91,900 |
| 2014 | $3,499 | $193,000 | $99,500 | $93,500 |
Source: Public Records
Map
Nearby Homes
- 350 Quincy St
- 350 Quincy St Unit 350
- 374 Quincy St
- 380 Quincy St
- 347 Quincy St
- 342 Quincy St
- 339 Quincy St
- 13 Beaumont Ave
- 336 Quincy St
- 328 Quincy St
- 324 Quincy St
- 318 Quincy St
- 314 Quincy St
- 312 Quincy St
- 310 Quincy St
- 305 Quincy St
- 826 Crescent St
- 826 Crescent St Unit 3
- 826 Crescent St Unit 2
- 803 Crescent St