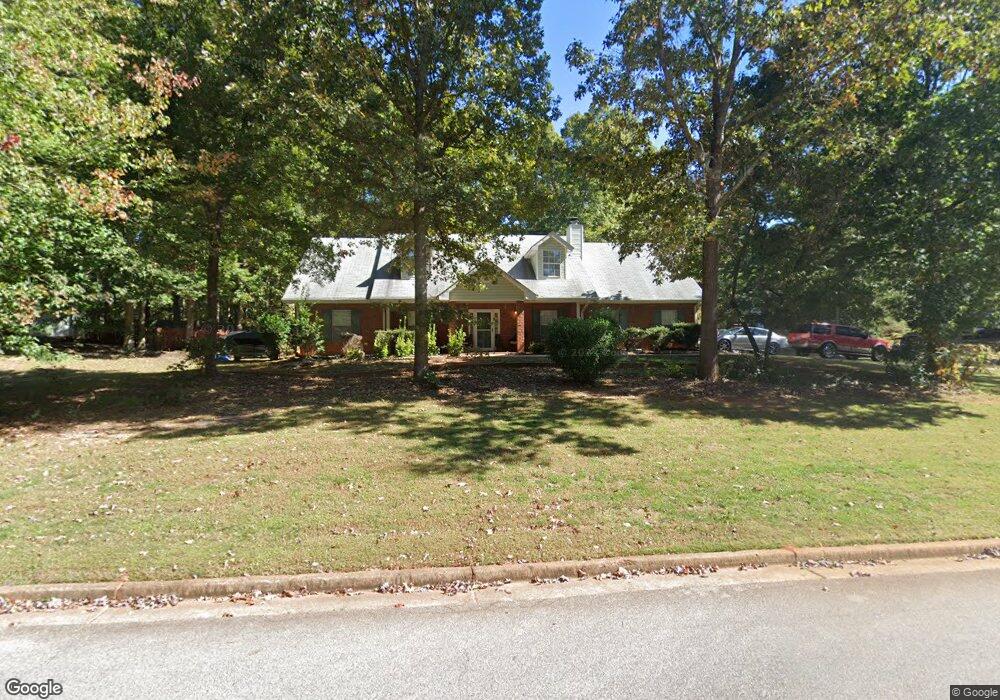
360 Radcliffe Trace Covington, GA 30016
Estimated Value: $309,000 - $348,000
4
Beds
3
Baths
2,174
Sq Ft
$150/Sq Ft
Est. Value
About This Home
This home is located at 360 Radcliffe Trace, Covington, GA 30016 and is currently estimated at $325,774, approximately $149 per square foot. 360 Radcliffe Trace is a home located in Newton County with nearby schools including West Newton Elementary School, Veterans Memorial Middle School, and Newton High School.
Ownership History
Date
Name
Owned For
Owner Type
Purchase Details
Closed on
Jun 13, 2018
Sold by
Boring Alan R
Bought by
Smith Christopher Allen and Smith Demetrica
Current Estimated Value
Home Financials for this Owner
Home Financials are based on the most recent Mortgage that was taken out on this home.
Original Mortgage
$157,102
Outstanding Balance
$135,318
Interest Rate
4.6%
Mortgage Type
FHA
Estimated Equity
$190,456
Purchase Details
Closed on
Oct 21, 1997
Sold by
Prickett Christopher
Bought by
Boring Shirley A and Boring Alan R
Home Financials for this Owner
Home Financials are based on the most recent Mortgage that was taken out on this home.
Original Mortgage
$100,000
Interest Rate
7.55%
Mortgage Type
New Conventional
Create a Home Valuation Report for This Property
The Home Valuation Report is an in-depth analysis detailing your home's value as well as a comparison with similar homes in the area
Home Values in the Area
Average Home Value in this Area
Purchase History
| Date | Buyer | Sale Price | Title Company |
|---|---|---|---|
| Smith Christopher Allen | -- | -- | |
| Smith Christopher Allen | $80,000 | -- | |
| Boring Shirley A | $118,900 | -- |
Source: Public Records
Mortgage History
| Date | Status | Borrower | Loan Amount |
|---|---|---|---|
| Open | Smith Christopher Allen | $157,102 | |
| Closed | Smith Christopher Allen | $157,102 | |
| Previous Owner | Boring Shirley A | $100,000 |
Source: Public Records
Tax History
| Year | Tax Paid | Tax Assessment Tax Assessment Total Assessment is a certain percentage of the fair market value that is determined by local assessors to be the total taxable value of land and additions on the property. | Land | Improvement |
|---|---|---|---|---|
| 2025 | $3,449 | $141,600 | $16,800 | $124,800 |
| 2024 | $3,486 | $140,200 | $16,800 | $123,400 |
| 2023 | $3,522 | $132,440 | $8,000 | $124,440 |
| 2022 | $3,263 | $122,920 | $8,000 | $114,920 |
| 2021 | $2,405 | $82,120 | $8,000 | $74,120 |
| 2020 | $2,282 | $70,880 | $8,000 | $62,880 |
| 2019 | $2,304 | $70,520 | $8,000 | $62,520 |
| 2018 | $2,148 | $61,640 | $8,000 | $53,640 |
| 2017 | $689 | $48,360 | $6,000 | $42,360 |
| 2016 | $479 | $42,240 | $4,000 | $38,240 |
| 2015 | $171 | $33,360 | $4,000 | $29,360 |
| 2014 | $169 | $33,360 | $0 | $0 |
Source: Public Records
Map
Nearby Homes
- 340 Radcliffe Trace
- 355 Radcliffe Trace
- 2273 Hampton Trail SE
- 210 Fox Glove Dr
- 2184 Hampton Trail SE
- 2004 Nolan Way
- 210 Pinewood Dr
- 215 Pinewood Dr
- 3440 Concord Corner SE
- 2145 Hampton Trail SE
- 2075 Pinewood Dr
- 1903 Old Concord Dr SE
- 215 Somerset Dr
- 3409 Salem Rd
- 3380 Colony Dr SE
- 3453 Underwood Rd SE
- 80 Fox Glove Dr Unit 3
- 2180 E Chester Cir SE
- 45 Sunset Ct
- 30 Pinewood Dr
- 25 Sarah Ct
- 380 Radcliffe Trace
- 430 Radcliffe Trace
- 365 Radcliffe Trace
- 35 Sarah Ct
- 375 Radcliffe Trace Unit 36
- 375 Radcliffe Trace
- 375 Radcliffe Trace
- 355 Radcliffe Trace Unit 34
- 385 Radcliffe Trace
- 30 Sarah Ct Unit 51
- 30 Sarah Ct
- 20 Sarah Ct Unit 51
- 20 Sarah Ct
- 440 Radcliffe Trace
- 345 Radcliffe Trace Unit 33
- 345 Radcliffe Trace
- 385 Valley Rd
- 395 Radcliffe Trace
- 335 Radcliffe Trace Unit 32
Your Personal Tour Guide
Ask me questions while you tour the home.