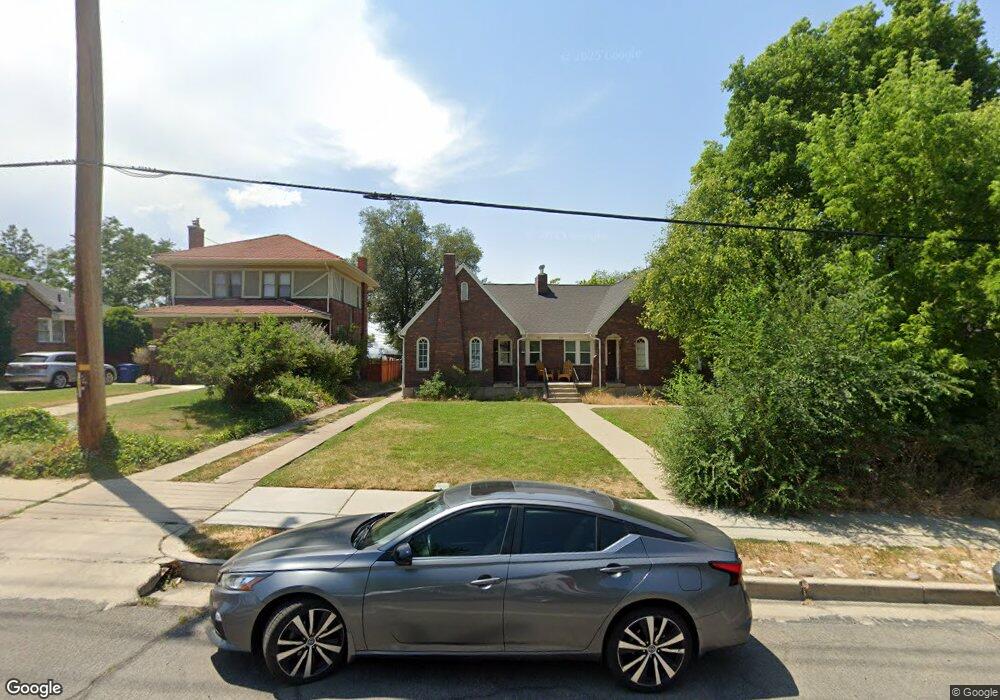
360 S 1100 E Unit 366 Salt Lake City, UT 84102
East Central NeighborhoodEstimated Value: $843,000 - $1,088,000
8
Beds
4
Baths
3,648
Sq Ft
$256/Sq Ft
Est. Value
About This Home
This home is located at 360 S 1100 E Unit 366, Salt Lake City, UT 84102 and is currently estimated at $932,569, approximately $255 per square foot. 360 S 1100 E Unit 366 is a home located in Salt Lake County with nearby schools including Bennion Elementary School, Wasatch Elementary School, and East High School.
Ownership History
Date
Name
Owned For
Owner Type
Purchase Details
Closed on
Jul 1, 2013
Sold by
R & R Financial Ventures Llc
Bought by
Corbin Ryan
Current Estimated Value
Home Financials for this Owner
Home Financials are based on the most recent Mortgage that was taken out on this home.
Original Mortgage
$288,750
Outstanding Balance
$208,805
Interest Rate
3.79%
Mortgage Type
New Conventional
Estimated Equity
$723,764
Purchase Details
Closed on
Dec 21, 2005
Sold by
Hoobler Ray and Hoobler Sherry
Bought by
R & R Financial Ventures Llc
Purchase Details
Closed on
Mar 3, 2005
Sold by
Kartchner Alan B and Kartchner Diane R
Bought by
Hoobler Ray and Hoobler Sherry
Home Financials for this Owner
Home Financials are based on the most recent Mortgage that was taken out on this home.
Original Mortgage
$258,400
Interest Rate
5.7%
Mortgage Type
Unknown
Create a Home Valuation Report for This Property
The Home Valuation Report is an in-depth analysis detailing your home's value as well as a comparison with similar homes in the area
Home Values in the Area
Average Home Value in this Area
Purchase History
| Date | Buyer | Sale Price | Title Company |
|---|---|---|---|
| Corbin Ryan | -- | Bonneville Superior Title | |
| R & R Financial Ventures Llc | -- | Accommodation | |
| Hoobler Ray | -- | Mountain View Title |
Source: Public Records
Mortgage History
| Date | Status | Borrower | Loan Amount |
|---|---|---|---|
| Open | Corbin Ryan | $288,750 | |
| Previous Owner | Hoobler Ray | $258,400 | |
| Closed | Hoobler Ray | $64,600 |
Source: Public Records
Tax History Compared to Growth
Tax History
| Year | Tax Paid | Tax Assessment Tax Assessment Total Assessment is a certain percentage of the fair market value that is determined by local assessors to be the total taxable value of land and additions on the property. | Land | Improvement |
|---|---|---|---|---|
| 2025 | $3,970 | $749,000 | $253,200 | $495,800 |
| 2024 | $3,970 | $757,400 | $239,600 | $517,800 |
| 2023 | $4,076 | $749,600 | $230,400 | $519,200 |
| 2022 | $4,532 | $782,000 | $225,800 | $556,200 |
| 2021 | $4,219 | $659,100 | $177,800 | $481,300 |
| 2020 | $3,436 | $510,900 | $173,000 | $337,900 |
| 2019 | $3,366 | $470,900 | $162,400 | $308,500 |
| 2018 | $3,325 | $453,000 | $162,400 | $290,600 |
| 2017 | $3,464 | $442,100 | $162,400 | $279,700 |
| 2016 | $3,344 | $405,300 | $113,400 | $291,900 |
| 2015 | $3,340 | $383,700 | $111,100 | $272,600 |
| 2014 | $3,226 | $367,600 | $108,900 | $258,700 |
Source: Public Records
Map
Nearby Homes
- 359 S 1100 E
- 405 S 1100 E
- 1044 E 400 S Unit 308A
- 1044 E 400 S Unit 407A
- 1116 E 400 S
- 425 S 1000 E Unit 204C
- 365 S Elizabeth St
- 1162 E 400 S
- 426 S 1000 E Unit 707
- 426 S 1000 E Unit 600
- 447 S 1200 E
- 515 S 1000 E Unit 406
- 515 S 1000 E Unit 504
- 515 S 1000 E Unit 706
- 515 S 1000 E Unit 1104
- 243 S Elizabeth St
- 1058 E 200 S
- 551 S Mcclelland St
- 552 S Mcclelland St
- 525 S 900 E Unit B2
- 354 S 1100 E
- 1063 E 400 S
- 374 S 1100 E
- 1067 E 400 S
- 378 S 1100 E
- 344 S 1100 E
- 1057 E 400 S
- 336 S 1100 E
- 1103 E 400 S
- 367 S 1100 E
- 1066 E 300 S
- 328 S 1100 E
- 353 S 1100 E
- 353 S 1100 E Unit 14
- 353 S 1100 E Unit 4
- 353 S 1100 E Unit 11
- 353 S 1100 E Unit 12
- 353 S 1100 E Unit 8
- 353 S 1100 E Unit 3
- 353 S 1100 E Unit 9