Estimated Value: $273,000 - $346,000
5
Beds
3
Baths
2,440
Sq Ft
$130/Sq Ft
Est. Value
About This Home
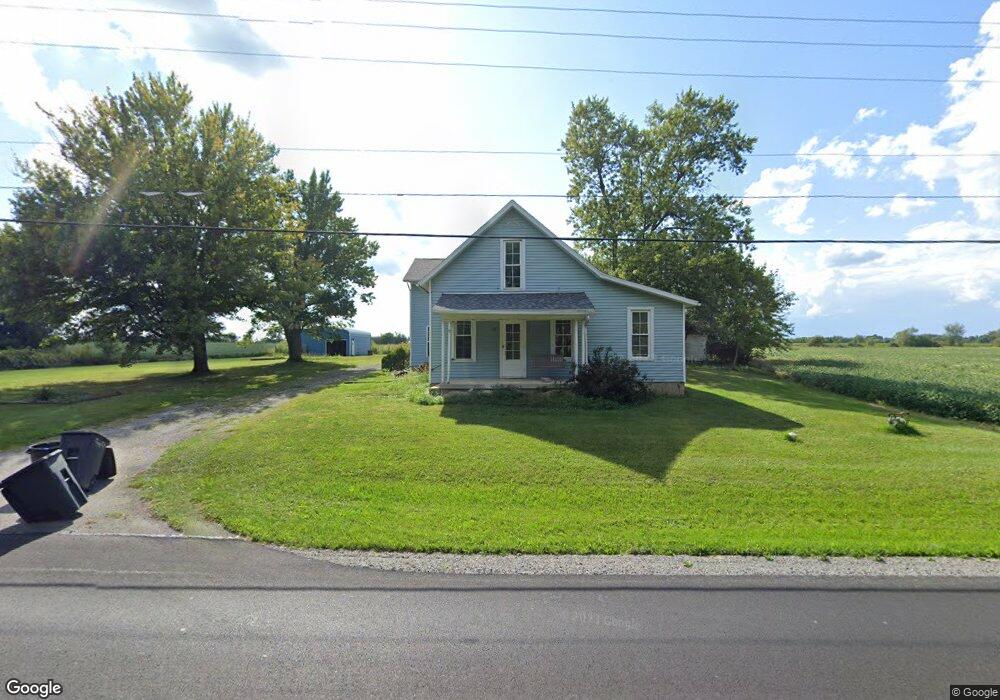
This home is located at 360 S Napoleon Rd, Lima, OH 45801 and is currently estimated at $316,456, approximately $129 per square foot. 360 S Napoleon Rd is a home located in Allen County with nearby schools including Allen East Elementary School, Allen East Middle School, and Allen East High School.
Ownership History
Date
Name
Owned For
Owner Type
Purchase Details
Closed on
Jan 25, 2024
Sold by
Maiello Margaret A and Maiello Robert L
Bought by
Roberts Nola N Eugene and Roberts Destiney Dawn
Current Estimated Value
Home Financials for this Owner
Home Financials are based on the most recent Mortgage that was taken out on this home.
Original Mortgage
$249,287
Outstanding Balance
$245,155
Interest Rate
6.95%
Mortgage Type
FHA
Estimated Equity
$71,301
Purchase Details
Closed on
Dec 16, 2022
Sold by
Rockhill Heather R
Bought by
Maiello Margaret A and Maiello Robert L
Purchase Details
Closed on
Oct 6, 2022
Sold by
Rockhill Keith A
Bought by
Rocklin Heather R and Davis Heather R
Purchase Details
Closed on
Mar 6, 2014
Sold by
Hunsaker James L and Hunsaker Amanda J
Bought by
Rockhill Heather R and Davis Jacalyn
Home Financials for this Owner
Home Financials are based on the most recent Mortgage that was taken out on this home.
Original Mortgage
$121,235
Interest Rate
4.39%
Mortgage Type
FHA
Create a Home Valuation Report for This Property
The Home Valuation Report is an in-depth analysis detailing your home's value as well as a comparison with similar homes in the area
Home Values in the Area
Average Home Value in this Area
Purchase History
| Date | Buyer | Sale Price | Title Company |
|---|---|---|---|
| Roberts Nola N Eugene | $275,000 | None Listed On Document | |
| Maiello Margaret A | $132,000 | -- | |
| Rocklin Heather R | -- | None Listed On Document | |
| Rockhill Heather R | $123,500 | None Available |
Source: Public Records
Mortgage History
| Date | Status | Borrower | Loan Amount |
|---|---|---|---|
| Open | Roberts Nola N Eugene | $249,287 | |
| Previous Owner | Rockhill Heather R | $121,235 |
Source: Public Records
Tax History Compared to Growth
Tax History
| Year | Tax Paid | Tax Assessment Tax Assessment Total Assessment is a certain percentage of the fair market value that is determined by local assessors to be the total taxable value of land and additions on the property. | Land | Improvement |
|---|---|---|---|---|
| 2024 | $3,036 | $89,040 | $9,590 | $79,450 |
| 2023 | $1,804 | $48,060 | $7,320 | $40,740 |
| 2022 | $2,607 | $46,560 | $7,320 | $39,240 |
| 2021 | $2,608 | $46,560 | $7,320 | $39,240 |
| 2020 | $2,483 | $42,110 | $6,620 | $35,490 |
| 2019 | $2,483 | $42,110 | $6,620 | $35,490 |
| 2018 | $2,414 | $42,110 | $6,620 | $35,490 |
| 2017 | $2,347 | $37,490 | $6,620 | $30,870 |
| 2016 | $2,325 | $37,490 | $6,620 | $30,870 |
| 2015 | $1,715 | $37,490 | $6,620 | $30,870 |
| 2014 | $1,715 | $32,830 | $6,300 | $26,530 |
| 2013 | $2,010 | $32,830 | $6,300 | $26,530 |
Source: Public Records
Map
Nearby Homes
- 000 Phillips Rd
- 312 S Woodlawn Ave
- 118 E Main St
- 647 Fisher Rd
- 200 S Main St
- 2327 N Phillips Rd
- 663 N Mcclure Rd
- 6782 County Road 15
- 1855 S Cool Rd
- 7165 Faulkner Rd
- 6616 Bellefontaine Rd
- 6381 McPheron Rd
- 5600 E Hanthorn Rd
- E Hanthorn Rd
- 5496 Sandusky Rd
- 4786 Harding Hwy
- 485 S Mumaugh Rd
- 4080 Bellefontaine Rd
- 211 Pinewood Cir
- 303 Pinewood Cir
- 360 S Napoleon Rd
- 425 S Napoleon Rd
- 325 S Napoleon Rd
- 470 S Napoleon Rd
- 443 S Napoleon Rd
- 501 S Napoleon Rd
- 538 S Napoleon Rd
- 600 S Napoleon Rd
- 105 N Phillips Rd
- 640 S Napoleon Rd
- 150 N Phillips Rd
- 8865 Harding Hwy
- 172 N Phillips Rd
- 105 N Napoleon Rd
- 120 N Napoleon Rd
- 8935 Harding Hwy
- 640 S Napoleon Rd
- 186 N Phillips Rd
- 710 S Phillips Rd