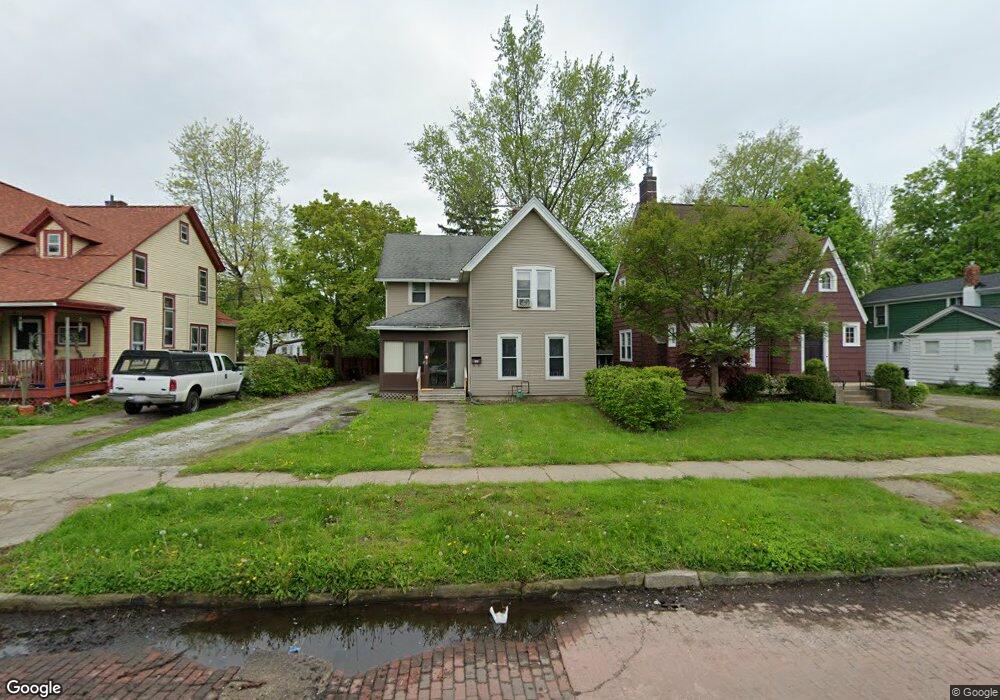
360 S Saint Clair St Painesville, OH 44077
Estimated Value: $147,000 - $192,000
3
Beds
1
Bath
1,636
Sq Ft
$106/Sq Ft
Est. Value
About This Home
This home is located at 360 S Saint Clair St, Painesville, OH 44077 and is currently estimated at $172,750, approximately $105 per square foot. 360 S Saint Clair St is a home located in Lake County with nearby schools including Chestnut Elementary School, Heritage Middle School, and Harvey High School.
Ownership History
Date
Name
Owned For
Owner Type
Purchase Details
Closed on
Feb 2, 2010
Sold by
Lamond Matthew S
Bought by
Lamond Matthew S and Rowan Keith G
Current Estimated Value
Purchase Details
Closed on
Mar 27, 2009
Sold by
Dixon Gerald D and Dixon Genevieve M
Bought by
Lamond Matthew S
Home Financials for this Owner
Home Financials are based on the most recent Mortgage that was taken out on this home.
Original Mortgage
$68,426
Outstanding Balance
$43,902
Interest Rate
5.22%
Mortgage Type
FHA
Estimated Equity
$128,848
Purchase Details
Closed on
Aug 2, 2005
Sold by
Dixon Gerald D and Dixon Genevieve M
Bought by
Dixon Gerald D and Dixon Genevieve M
Purchase Details
Closed on
Nov 20, 1998
Sold by
Dixon Gerald D
Bought by
Dixon Gerald D and Dixon Genevieve
Home Financials for this Owner
Home Financials are based on the most recent Mortgage that was taken out on this home.
Original Mortgage
$72,500
Interest Rate
6.69%
Purchase Details
Closed on
Oct 26, 1992
Bought by
Dixon Gerald D
Create a Home Valuation Report for This Property
The Home Valuation Report is an in-depth analysis detailing your home's value as well as a comparison with similar homes in the area
Home Values in the Area
Average Home Value in this Area
Purchase History
| Date | Buyer | Sale Price | Title Company |
|---|---|---|---|
| Lamond Matthew S | -- | Accommodation | |
| Lamond Matthew S | $69,700 | Realty Title | |
| Dixon Gerald D | -- | None Available | |
| Dixon Gerald D | -- | Bates Title Corp | |
| Dixon Gerald D | -- | -- |
Source: Public Records
Mortgage History
| Date | Status | Borrower | Loan Amount |
|---|---|---|---|
| Open | Lamond Matthew S | $68,426 | |
| Previous Owner | Dixon Gerald D | $72,500 |
Source: Public Records
Tax History Compared to Growth
Tax History
| Year | Tax Paid | Tax Assessment Tax Assessment Total Assessment is a certain percentage of the fair market value that is determined by local assessors to be the total taxable value of land and additions on the property. | Land | Improvement |
|---|---|---|---|---|
| 2024 | -- | $54,080 | $7,650 | $46,430 |
| 2023 | $4,503 | $36,360 | $6,290 | $30,070 |
| 2022 | $2,209 | $36,360 | $6,290 | $30,070 |
| 2021 | $2,209 | $36,360 | $6,290 | $30,070 |
| 2020 | $2,139 | $30,810 | $5,330 | $25,480 |
| 2019 | $2,160 | $30,810 | $5,330 | $25,480 |
| 2018 | $2,085 | $26,470 | $7,430 | $19,040 |
| 2017 | $1,883 | $26,470 | $7,430 | $19,040 |
| 2016 | $1,873 | $26,470 | $7,430 | $19,040 |
| 2015 | $1,828 | $26,470 | $7,430 | $19,040 |
| 2014 | $1,822 | $26,470 | $7,430 | $19,040 |
| 2013 | $1,816 | $26,470 | $7,430 | $19,040 |
Source: Public Records
Map
Nearby Homes
- 48 Lusard St
- 179 Alcott Place
- 287 Liberty St
- 83 E South St
- 414 Liberty St
- 498 Bank St
- 193 Steele Ave
- 88 W Washington St
- 583 Trailwood Dr
- 736 Rivers Edge Ln Unit 68
- 823 Homewood Dr
- 258 Avery Terrace
- 850 Bank St
- 347 Townmill Ct
- 267 Rockwood Dr
- 210 Luary Dr
- 881 Rivers Edge Ln
- 396 W Jackson St
- 48 Nelmar Dr
- 540 Mentor Ave
- 360 S St Clair
- 350 S Saint Clair St
- 366 S Saint Clair St
- 342 S Saint Clair St
- 374 S Saint Clair St
- 159 Lusard St
- 163 Lusard St
- 351 Willow Dr
- 153 Lusard St
- 345 Willow Dr
- 324 S Saint Clair St
- 334 S Saint Clair St
- 339 Willow Dr
- 147 Lusard St
- 390 S Saint Clair St
- 331 Willow Dr
- 164 Lusard St
- 326 S Saint Clair St
- 383 S Saint Clair St
- 325 Willow Dr