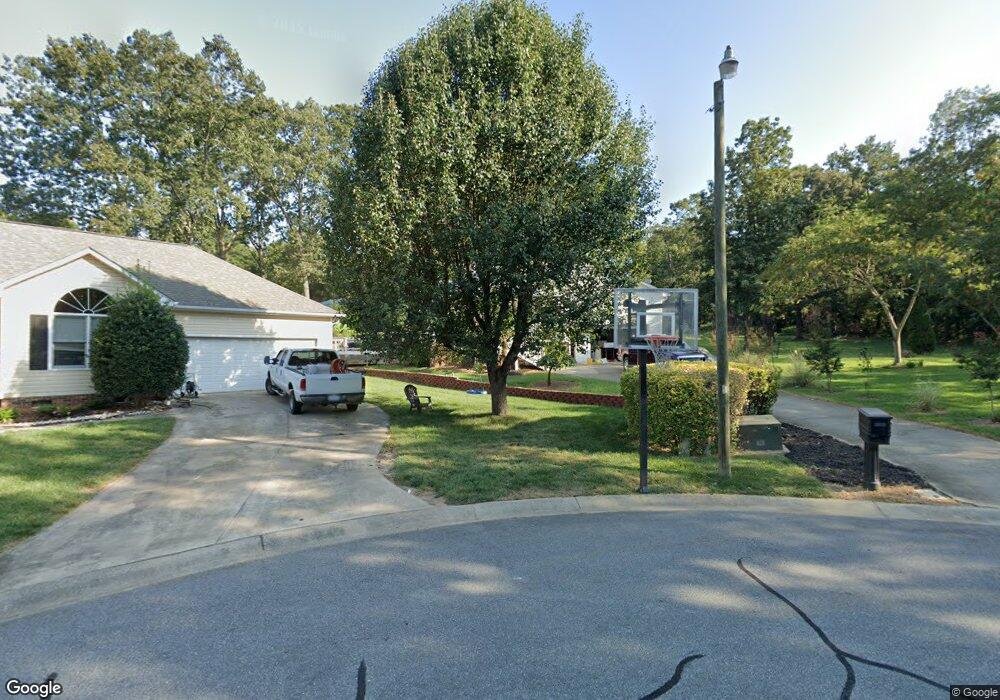
360 Stonehaven Ct SW Concord, NC 28027
Estimated Value: $365,000 - $429,000
3
Beds
2
Baths
2,254
Sq Ft
$170/Sq Ft
Est. Value
About This Home
This home is located at 360 Stonehaven Ct SW, Concord, NC 28027 and is currently estimated at $383,181, approximately $170 per square foot. 360 Stonehaven Ct SW is a home located in Cabarrus County with nearby schools including Wolf Meadow Elementary School, J.N. Fries Middle School, and Branch Christian Academy Concord.
Ownership History
Date
Name
Owned For
Owner Type
Purchase Details
Closed on
Oct 5, 2011
Sold by
Farmers & Merchants Bank
Bought by
Nichols Mark E and Nichols Cathy A
Current Estimated Value
Purchase Details
Closed on
Jul 8, 2011
Sold by
Herrick Kimberly A
Bought by
Farmers & Merchants Bank and F&M Bank
Purchase Details
Closed on
Nov 28, 2005
Sold by
Brindle Kay W and Brindle Jackie O
Bought by
Nichols Mark E and Nichols Cathy Ann
Home Financials for this Owner
Home Financials are based on the most recent Mortgage that was taken out on this home.
Original Mortgage
$110,000
Interest Rate
6%
Mortgage Type
Fannie Mae Freddie Mac
Purchase Details
Closed on
Nov 18, 2002
Sold by
Tarrymore Enterprises Inc
Bought by
Brindle Jackie O and Brindle Kay W
Home Financials for this Owner
Home Financials are based on the most recent Mortgage that was taken out on this home.
Original Mortgage
$126,000
Interest Rate
5.95%
Mortgage Type
Construction
Create a Home Valuation Report for This Property
The Home Valuation Report is an in-depth analysis detailing your home's value as well as a comparison with similar homes in the area
Home Values in the Area
Average Home Value in this Area
Purchase History
| Date | Buyer | Sale Price | Title Company |
|---|---|---|---|
| Nichols Mark E | $6,000 | None Available | |
| Farmers & Merchants Bank | $11,978 | None Available | |
| Nichols Mark E | $156,500 | -- | |
| Tarrymore Enterprises Inc | -- | -- | |
| Brindle Jackie O | $23,000 | -- |
Source: Public Records
Mortgage History
| Date | Status | Borrower | Loan Amount |
|---|---|---|---|
| Previous Owner | Tarrymore Enterprises Inc | $110,000 | |
| Previous Owner | Brindle Jackie O | $126,000 | |
| Closed | Brindle Jackie O | $23,000 |
Source: Public Records
Tax History Compared to Growth
Tax History
| Year | Tax Paid | Tax Assessment Tax Assessment Total Assessment is a certain percentage of the fair market value that is determined by local assessors to be the total taxable value of land and additions on the property. | Land | Improvement |
|---|---|---|---|---|
| 2025 | $3,590 | $360,490 | $66,000 | $294,490 |
| 2024 | $3,590 | $360,490 | $66,000 | $294,490 |
| 2023 | $2,824 | $231,510 | $44,000 | $187,510 |
| 2022 | $2,805 | $229,940 | $44,000 | $185,940 |
| 2021 | $2,805 | $229,940 | $44,000 | $185,940 |
| 2020 | $2,805 | $229,940 | $44,000 | $185,940 |
| 2019 | $2,324 | $190,480 | $34,000 | $156,480 |
| 2018 | $2,286 | $190,480 | $34,000 | $156,480 |
| 2017 | $2,248 | $190,480 | $34,000 | $156,480 |
| 2016 | $1,333 | $182,860 | $34,000 | $148,860 |
| 2015 | $2,158 | $182,860 | $34,000 | $148,860 |
| 2014 | $2,158 | $182,860 | $34,000 | $148,860 |
Source: Public Records
Map
Nearby Homes
- 668 Jackson Terrace SW
- 664 Jackson Terrace SW
- 1067 Old Charlotte Rd
- 1255 Old Charlotte Rd
- 933 Old Charlotte Rd
- 1022 Van Gogh Dr SW
- Lot #2 Faith Dr SW
- 84 Highland Ave SW
- 82 Highland Ave SW
- 1030 Van Gogh Dr SW
- 609 Faith Dr SW Unit 1
- 207 Highland Ave SW
- 220 Highland Ave SW
- 809 Fargo Dr SW
- 782 Chalice St SW
- 1239 Kent Downs Ave SW
- 1220 Kent Downs Ave SW
- 818 Rubens Rd SW
- 2893 Signal Ct SW
- 758 Main St SW
- 352 Stonehaven Ct SW
- 368 Stonehaven Ct SW
- 101 Hickory Grove Dr SW
- 99 Hickory Grove Dr SW
- 344 Stonehaven Ct SW
- 376 Stonehaven Ct SW
- 97 Hickory Grove Dr SW
- LOT 13 Stonehaven Ct
- 105 Hickory Grove Dr SW
- 95 Hickory Grove Dr SW
- 384 Stonehaven Ct SW
- 384 Stonehaven Ct SW
- 375 Stonehaven Ct SW
- 100 Hickory Grove Dr SW
- 91 Hickory Grove Dr SW
- 98 Hickory Grove Dr SW
- 392 Stonehaven Ct SW
- 421 Kingfield Dr SW
- 417 Kingfield Dr SW
- 425 Kingfield Dr SW