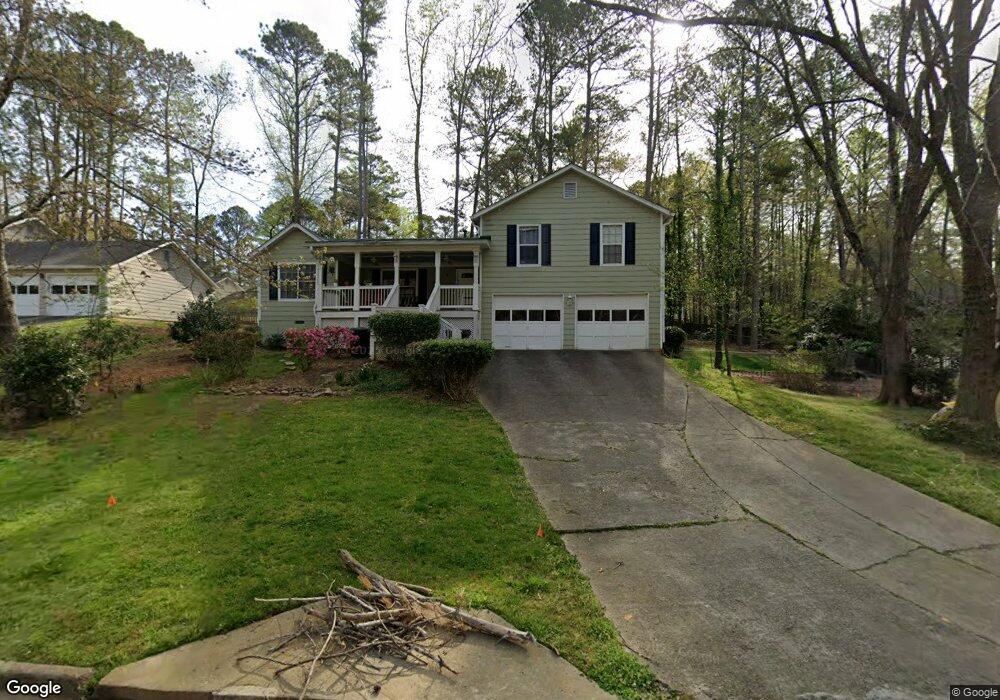
360 Tyson Cir Unit 71 Roswell, GA 30076
Estimated Value: $441,000 - $450,000
3
Beds
2
Baths
1,544
Sq Ft
$288/Sq Ft
Est. Value
About This Home
This home is located at 360 Tyson Cir Unit 71, Roswell, GA 30076 and is currently estimated at $444,328, approximately $287 per square foot. 360 Tyson Cir Unit 71 is a home located in Fulton County with nearby schools including Northwood Elementary School, Haynes Bridge Middle School, and Centennial High School.
Ownership History
Date
Name
Owned For
Owner Type
Purchase Details
Closed on
Nov 26, 2013
Sold by
U S Department Of Housing
Bought by
Yaqub Zohra and Yaqub Hamida
Current Estimated Value
Purchase Details
Closed on
Jul 2, 2013
Sold by
Suntrust Mtg Inc
Bought by
Department Of Housing And Urba
Purchase Details
Closed on
Dec 11, 2008
Sold by
Flagstar Bank Fsb
Bought by
Dean James E
Home Financials for this Owner
Home Financials are based on the most recent Mortgage that was taken out on this home.
Original Mortgage
$167,687
Interest Rate
5.43%
Mortgage Type
FHA
Purchase Details
Closed on
Jan 2, 2008
Sold by
Putzer Brandon N and Putzer Sarah
Bought by
Flagstar Bank Fsb
Purchase Details
Closed on
Mar 15, 1999
Sold by
Yurman Belle
Bought by
Putzer Brandon N
Home Financials for this Owner
Home Financials are based on the most recent Mortgage that was taken out on this home.
Original Mortgage
$127,050
Interest Rate
7.08%
Mortgage Type
New Conventional
Create a Home Valuation Report for This Property
The Home Valuation Report is an in-depth analysis detailing your home's value as well as a comparison with similar homes in the area
Home Values in the Area
Average Home Value in this Area
Purchase History
| Date | Buyer | Sale Price | Title Company |
|---|---|---|---|
| Yaqub Zohra | $150,000 | -- | |
| Department Of Housing And Urba | -- | -- | |
| Suntrust Mtg Inc | -- | -- | |
| Dean James E | $169,900 | -- | |
| Flagstar Bank Fsb | $166,999 | -- | |
| Putzer Brandon N | $131,500 | -- |
Source: Public Records
Mortgage History
| Date | Status | Borrower | Loan Amount |
|---|---|---|---|
| Previous Owner | Dean James E | $167,687 | |
| Previous Owner | Putzer Brandon N | $127,050 |
Source: Public Records
Tax History
| Year | Tax Paid | Tax Assessment Tax Assessment Total Assessment is a certain percentage of the fair market value that is determined by local assessors to be the total taxable value of land and additions on the property. | Land | Improvement |
|---|---|---|---|---|
| 2025 | $475 | $149,400 | $40,600 | $108,800 |
| 2023 | $4,301 | $152,360 | $41,360 | $111,000 |
| 2022 | $1,759 | $131,120 | $26,160 | $104,960 |
| 2021 | $2,102 | $111,560 | $29,800 | $81,760 |
| 2020 | $2,130 | $105,160 | $27,920 | $77,240 |
| 2018 | $2,099 | $94,400 | $20,440 | $73,960 |
| 2017 | $1,694 | $70,000 | $12,960 | $57,040 |
| 2016 | $1,692 | $70,000 | $12,960 | $57,040 |
Source: Public Records
Map
Nearby Homes
- 385 Tyson Cir
- 1835 Old Alabama Rd
- 525 Ansley Dr
- 115 Ansley Ct
- 137 Weatherburne Dr
- 2025 Kristian Way
- 1245 Terramont Dr
- 655 Cranberry Ct
- 1005 Cranberry Creek
- 780 Crab Orchard Dr
- 590 Ridgemont Dr
- 970 Laurel Mill Dr
- 725 Crab Orchard Dr
- 130 Spring Ridge Ct
- 1015 Terramont Dr
- 1050 Terramont Dr
- 860 Waterbrook Ct
- 635 Cranberry Trail
- 485 Sheringham Ct
- 260 Spring Ridge Dr
- 360 Tyson Cir Unit 1980
- 360 Tyson Cir
- 350 Tyson Cir
- 615 Tyson Ct
- 400 Tyson Cir
- 625 Tyson Ct
- 420 Tyson Cir
- 365 Tyson Cir
- 605 Tyson Ct
- 355 Tyson Cir Unit 2
- 375 Tyson Cir Unit 2
- 330 Tyson Cir Unit 2
- 430 Tyson Cir
- 345 Tyson Cir
- 290 Tyson Cir
- 620 Tyson Ct
- 440 Tyson Cir Unit 2
- 335 Tyson Cir Unit 2
- 415 Tyson Cir Unit 2
- 600 Tyson Ct
Your Personal Tour Guide
Ask me questions while you tour the home.