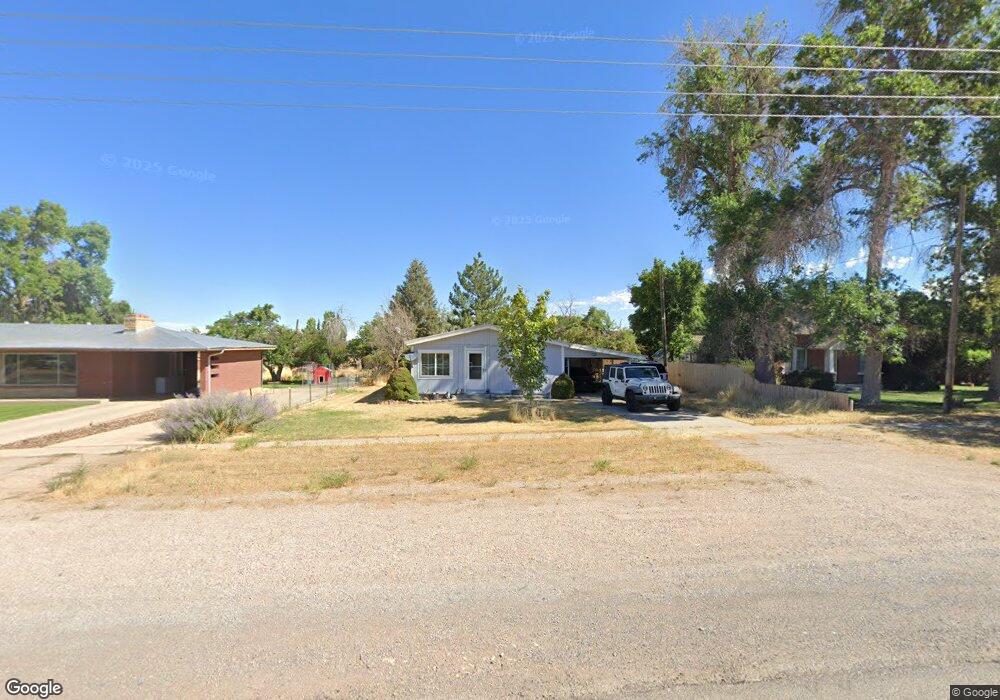
360 W 100 N Fillmore, UT 84631
Estimated Value: $244,947 - $420,000
2
Beds
2
Baths
1,356
Sq Ft
$230/Sq Ft
Est. Value
About This Home
This home is located at 360 W 100 N, Fillmore, UT 84631 and is currently estimated at $311,737, approximately $229 per square foot. 360 W 100 N is a home located in Millard County.
Ownership History
Date
Name
Owned For
Owner Type
Purchase Details
Closed on
Dec 2, 2024
Sold by
Whatcott Tracy A and Whatcott Lori Lynne
Bought by
Whatcott Family Trust and Whatcott
Current Estimated Value
Purchase Details
Closed on
Nov 22, 2021
Sold by
Clinton Corbett Adrian
Bought by
Bess Ann O
Home Financials for this Owner
Home Financials are based on the most recent Mortgage that was taken out on this home.
Original Mortgage
$11,180
Interest Rate
3.1%
Purchase Details
Closed on
Dec 24, 2014
Sold by
Raymon Raymon and Taylor Julia
Bought by
Taylor Fred J and Carling Raymon
Purchase Details
Closed on
Nov 5, 2012
Sold by
Whatcott Tracy and Whatcott Tracy A
Bought by
Whatcott Tracy and Whatcott Lori
Purchase Details
Closed on
Nov 3, 2012
Sold by
Carling Fred J
Bought by
Whatcott Tracy and Whatcott Lori
Create a Home Valuation Report for This Property
The Home Valuation Report is an in-depth analysis detailing your home's value as well as a comparison with similar homes in the area
Home Values in the Area
Average Home Value in this Area
Purchase History
| Date | Buyer | Sale Price | Title Company |
|---|---|---|---|
| Whatcott Family Trust | -- | None Listed On Document | |
| Bess Ann O | -- | First American Title | |
| Taylor Fred J | -- | First American Title Insur | |
| Whatcott Tracy | -- | First American Title Insuran | |
| Whatcott Tracy | -- | First American Title Insuran |
Source: Public Records
Mortgage History
| Date | Status | Borrower | Loan Amount |
|---|---|---|---|
| Previous Owner | Bess Ann O | $11,180 | |
| Previous Owner | Bess Ann O | $200,305 |
Source: Public Records
Tax History Compared to Growth
Tax History
| Year | Tax Paid | Tax Assessment Tax Assessment Total Assessment is a certain percentage of the fair market value that is determined by local assessors to be the total taxable value of land and additions on the property. | Land | Improvement |
|---|---|---|---|---|
| 2025 | $961 | $120,676 | $25,293 | $95,383 |
| 2024 | $961 | $106,062 | $20,292 | $85,770 |
| 2023 | $1,166 | $106,062 | $20,292 | $85,770 |
| 2022 | $995 | $89,382 | $18,448 | $70,934 |
| 2021 | $937 | $80,816 | $11,979 | $68,837 |
| 2020 | $868 | $75,263 | $10,890 | $64,373 |
| 2019 | $741 | $64,495 | $10,890 | $53,605 |
| 2018 | $707 | $62,983 | $10,890 | $52,093 |
| 2017 | $627 | $53,088 | $10,890 | $42,198 |
| 2016 | $600 | $53,088 | $10,890 | $42,198 |
| 2015 | $600 | $53,088 | $10,890 | $42,198 |
| 2014 | -- | $53,088 | $10,890 | $42,198 |
| 2013 | -- | $53,088 | $10,890 | $42,198 |
Source: Public Records
Map
Nearby Homes
- 225 W 200 St N
- 165 N 100 W
- 75 N 100 West St
- 335 W 400 North St
- 295 N 100 West St
- 380 N 200 St W
- 390 N 100 W
- 310 S 500 West Rd
- 410 W 400 N
- 40 S 100 Rd E
- 120 S 100 East Rd
- 190 W 400 St S
- 220 S 200 E
- 155 E 500 St S
- 157 E 500 South St
- 430 E Canyon Rd
- 405 E 500 St S
- 310 S 600 E
- 2155 N Cedar Mountain Rd
- 2835 N Cedar Mountain Rd