Estimated Value: $429,000 - $471,000
4
Beds
2
Baths
1,854
Sq Ft
$243/Sq Ft
Est. Value
About This Home
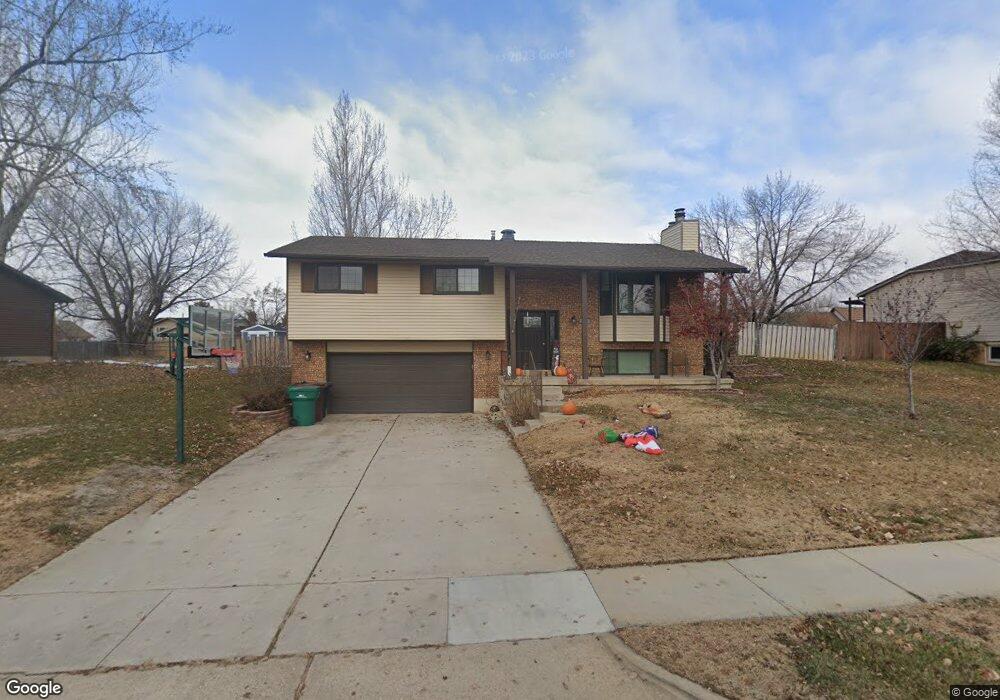
This home is located at 360 W 1550 N, Ogden, UT 84404 and is currently estimated at $450,853, approximately $243 per square foot. 360 W 1550 N is a home located in Weber County with nearby schools including Pioneer School, Orion Junior High School, and Fremont High School.
Ownership History
Date
Name
Owned For
Owner Type
Purchase Details
Closed on
Mar 14, 2022
Sold by
Buhlig and Laura
Bought by
Paredes Rebecca and Paredes Mario A
Current Estimated Value
Purchase Details
Closed on
Mar 30, 2016
Bought by
Buhlig Timothy
Home Financials for this Owner
Home Financials are based on the most recent Mortgage that was taken out on this home.
Original Mortgage
$163,000
Interest Rate
3.71%
Purchase Details
Closed on
Oct 9, 2002
Sold by
Greenwell Lynn D and Greenwell Maurine
Bought by
Fureigh David W
Home Financials for this Owner
Home Financials are based on the most recent Mortgage that was taken out on this home.
Original Mortgage
$133,119
Interest Rate
6.17%
Mortgage Type
FHA
Create a Home Valuation Report for This Property
The Home Valuation Report is an in-depth analysis detailing your home's value as well as a comparison with similar homes in the area
Home Values in the Area
Average Home Value in this Area
Purchase History
| Date | Buyer | Sale Price | Title Company |
|---|---|---|---|
| Paredes Rebecca | -- | Old Republic Title | |
| Buhlig Timothy | -- | -- | |
| Fureigh David W | -- | Backman Stewart Title |
Source: Public Records
Mortgage History
| Date | Status | Borrower | Loan Amount |
|---|---|---|---|
| Previous Owner | Buhlig Timothy | $160,868 | |
| Previous Owner | Buhlig Timothy | $163,000 | |
| Previous Owner | Buhlig Timothy | -- | |
| Previous Owner | Fureigh David W | $133,119 | |
| Closed | Fureigh David W | $5,324 |
Source: Public Records
Tax History
| Year | Tax Paid | Tax Assessment Tax Assessment Total Assessment is a certain percentage of the fair market value that is determined by local assessors to be the total taxable value of land and additions on the property. | Land | Improvement |
|---|---|---|---|---|
| 2025 | $2,909 | $417,730 | $141,809 | $275,921 |
| 2024 | $2,879 | $226,049 | $77,994 | $148,055 |
| 2023 | $2,964 | $237,050 | $77,841 | $159,209 |
| 2022 | $2,871 | $234,850 | $66,809 | $168,041 |
| 2021 | $239 | $321,000 | $71,292 | $249,708 |
| 2020 | $233 | $265,000 | $55,902 | $209,098 |
| 2019 | $233 | $250,000 | $55,902 | $194,098 |
| 2018 | $1,813 | $221,000 | $48,922 | $172,078 |
| 2017 | $227 | $181,403 | $44,927 | $136,476 |
| 2016 | $1,576 | $96,778 | $23,312 | $73,466 |
| 2015 | $1,339 | $79,563 | $23,312 | $56,251 |
| 2014 | $1,382 | $81,197 | $23,312 | $57,885 |
Source: Public Records
Map
Nearby Homes
- 1743 N 400 W
- 2458 N Highway 89 Hwy
- 2440 U S Highway 89
- 1307 N 225 W
- 247 E 1825 N Unit 11
- 247 E 1825 N Unit 7
- 247 E 1825 N Unit 5
- 512 W 1875 N
- 180 W 1825 N
- 1212 N Virginia Ave
- 1912 N 300 W
- 337 W 1925 N
- 248 W 1950 N
- 1978 N 225 W Unit 72
- 1255 N 300 East St Unit 183
- 1249 N 300 East St Unit 184
- 315 E 1650 N Unit 124
- 315 E 1650 N Unit 125
- 315 E 1650 N Unit 127
- 247 E 1850 N Unit 4
Your Personal Tour Guide
Ask me questions while you tour the home.