Estimated Value: $384,000 - $445,000
4
Beds
1
Bath
952
Sq Ft
$424/Sq Ft
Est. Value
About This Home
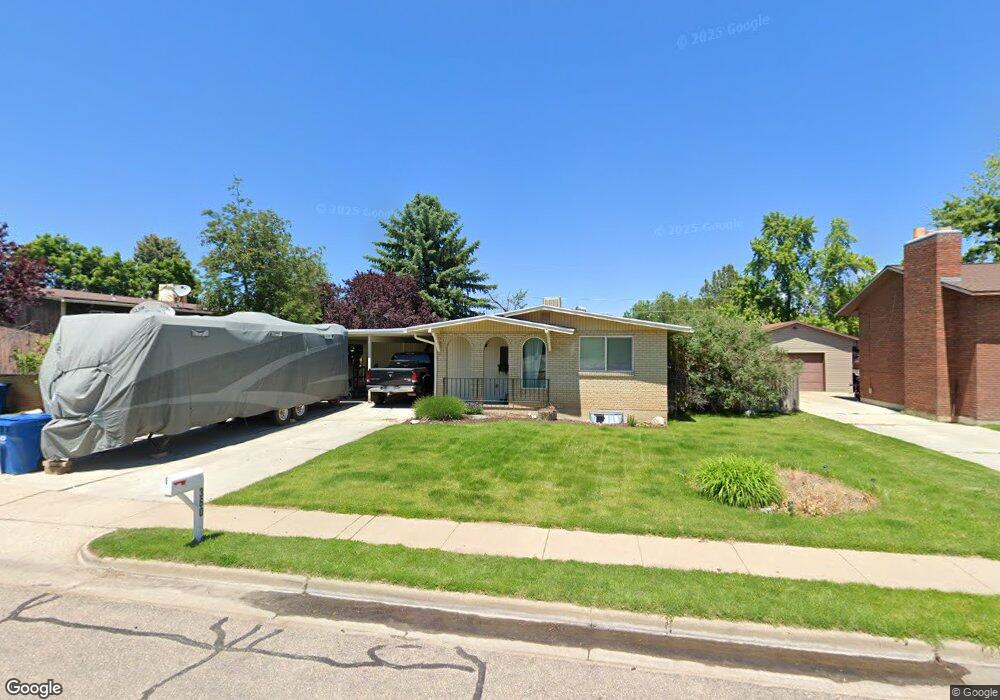
This home is located at 360 W 5050 S, Ogden, UT 84405 and is currently estimated at $404,023, approximately $424 per square foot. 360 W 5050 S is a home located in Weber County with nearby schools including Roosevelt School, T.H. Bell Junior High School, and Bonneville High School.
Ownership History
Date
Name
Owned For
Owner Type
Purchase Details
Closed on
Nov 6, 2020
Sold by
Kapple Dixon Dean
Bought by
Kapple Dixon Dean
Current Estimated Value
Home Financials for this Owner
Home Financials are based on the most recent Mortgage that was taken out on this home.
Original Mortgage
$232,000
Outstanding Balance
$206,447
Interest Rate
2.8%
Mortgage Type
New Conventional
Estimated Equity
$197,576
Purchase Details
Closed on
Sep 18, 2019
Sold by
Kapple Dixon Dean
Bought by
Kapple Dixon Dean
Purchase Details
Closed on
Jun 16, 2009
Sold by
Shreeve Gregory Wayne and Shreeve Susan B
Bought by
Kapple Dixon Dean
Home Financials for this Owner
Home Financials are based on the most recent Mortgage that was taken out on this home.
Original Mortgage
$160,047
Interest Rate
4.83%
Mortgage Type
FHA
Purchase Details
Closed on
May 26, 2006
Sold by
Shreeve Greg W
Bought by
Shreeve Susan B
Create a Home Valuation Report for This Property
The Home Valuation Report is an in-depth analysis detailing your home's value as well as a comparison with similar homes in the area
Home Values in the Area
Average Home Value in this Area
Purchase History
| Date | Buyer | Sale Price | Title Company |
|---|---|---|---|
| Kapple Dixon Dean | -- | Us Title Insurance Agency | |
| Kapple Dixon Dean | -- | Stewart Title Ins Agcy Of | |
| Kapple Dixon Dean | -- | First American Fashion Point | |
| Shreeve Susan B | -- | None Available |
Source: Public Records
Mortgage History
| Date | Status | Borrower | Loan Amount |
|---|---|---|---|
| Open | Kapple Dixon Dean | $232,000 | |
| Closed | Kapple Dixon Dean | $160,047 |
Source: Public Records
Tax History
| Year | Tax Paid | Tax Assessment Tax Assessment Total Assessment is a certain percentage of the fair market value that is determined by local assessors to be the total taxable value of land and additions on the property. | Land | Improvement |
|---|---|---|---|---|
| 2025 | $2,435 | $355,254 | $111,179 | $244,075 |
| 2024 | $2,336 | $190,849 | $61,148 | $129,701 |
| 2023 | $2,279 | $186,450 | $60,916 | $125,534 |
| 2022 | $2,344 | $199,650 | $58,188 | $141,462 |
| 2021 | $1,840 | $251,000 | $55,645 | $195,355 |
| 2020 | $1,748 | $217,000 | $45,492 | $171,508 |
| 2019 | $1,664 | $190,000 | $45,492 | $144,508 |
| 2018 | $1,445 | $159,000 | $45,492 | $113,508 |
| 2017 | $1,337 | $136,000 | $34,461 | $101,539 |
| 2016 | $1,201 | $65,498 | $18,265 | $47,233 |
| 2015 | $1,166 | $62,011 | $18,265 | $43,746 |
| 2014 | $1,163 | $61,751 | $18,265 | $43,486 |
Source: Public Records
Map
Nearby Homes
Your Personal Tour Guide
Ask me questions while you tour the home.