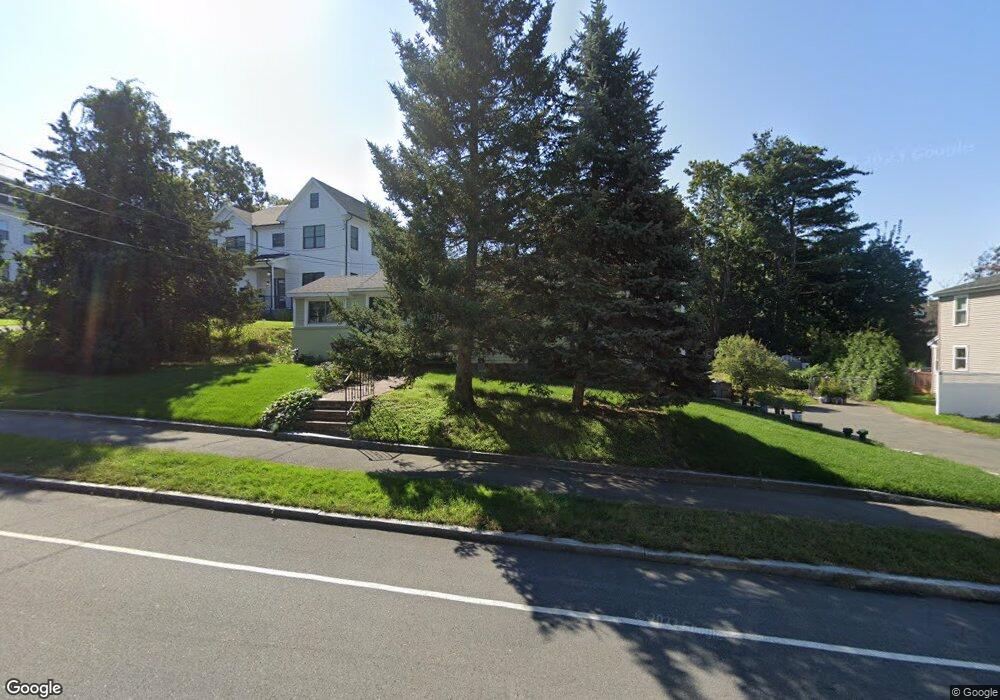
360 West St Unit 360 Needham Heights, MA 02494
Estimated Value: $1,168,801 - $1,236,000
3
Beds
2
Baths
1,230
Sq Ft
$981/Sq Ft
Est. Value
About This Home
This home is located at 360 West St Unit 360, Needham Heights, MA 02494 and is currently estimated at $1,206,200, approximately $980 per square foot. 360 West St Unit 360 is a home located in Norfolk County with nearby schools including Sunita L. Williams Elementary School, High Rock Middle School, and Pollard Middle School.
Ownership History
Date
Name
Owned For
Owner Type
Purchase Details
Closed on
Dec 30, 1999
Sold by
Zamashkin Aleksandr
Bought by
Leader Tatyana
Current Estimated Value
Home Financials for this Owner
Home Financials are based on the most recent Mortgage that was taken out on this home.
Original Mortgage
$177,500
Interest Rate
7.71%
Mortgage Type
Purchase Money Mortgage
Purchase Details
Closed on
Feb 27, 1998
Sold by
Hite Cheryl E
Bought by
Zamashkin Aleksandr
Create a Home Valuation Report for This Property
The Home Valuation Report is an in-depth analysis detailing your home's value as well as a comparison with similar homes in the area
Home Values in the Area
Average Home Value in this Area
Purchase History
| Date | Buyer | Sale Price | Title Company |
|---|---|---|---|
| Leader Tatyana | $222,000 | -- | |
| Zamashkin Aleksandr | $217,200 | -- | |
| Zamashkin Aleksandr | $217,200 | -- |
Source: Public Records
Mortgage History
| Date | Status | Borrower | Loan Amount |
|---|---|---|---|
| Open | Zamashkin Aleksandr | $435,200 | |
| Closed | Zamashkin Aleksandr | $344,000 | |
| Closed | Zamashkin Aleksandr | $177,500 |
Source: Public Records
Tax History Compared to Growth
Tax History
| Year | Tax Paid | Tax Assessment Tax Assessment Total Assessment is a certain percentage of the fair market value that is determined by local assessors to be the total taxable value of land and additions on the property. | Land | Improvement |
|---|---|---|---|---|
| 2025 | $8,961 | $845,400 | $675,000 | $170,400 |
| 2024 | $9,400 | $750,800 | $492,900 | $257,900 |
| 2023 | $9,604 | $736,500 | $492,900 | $243,600 |
| 2022 | $9,118 | $682,000 | $444,200 | $237,800 |
| 2021 | $8,886 | $682,000 | $444,200 | $237,800 |
| 2020 | $8,763 | $701,600 | $444,200 | $257,400 |
| 2019 | $6,947 | $560,700 | $404,000 | $156,700 |
| 2018 | $6,661 | $560,700 | $404,000 | $156,700 |
| 2017 | $6,434 | $541,100 | $404,000 | $137,100 |
| 2016 | $4,925 | $426,800 | $363,800 | $63,000 |
| 2015 | $4,819 | $426,800 | $363,800 | $63,000 |
| 2014 | $4,582 | $393,600 | $330,900 | $62,700 |
Source: Public Records
Map
Nearby Homes
- 34 Pershing Rd
- 35 Andrea Cir
- 3 Crescent Rd
- 445 Hillside Ave
- 379 Hunnewell St Unit 379
- 381 Hunnewell St Unit 381
- 403 Hunnewell St Unit 403
- 400 Hunnewell St Unit 103
- 12 Hill St
- 132 Hillside Ave
- 7 Avery St
- 98 Hunnewell St
- 443 Central Ave
- 556 Webster St
- 77 High St
- 345 Central Ave
- 36 Davenport Rd
- 78 Hunnewell St
- 62 Evelyn Rd
- 310 Oakland St