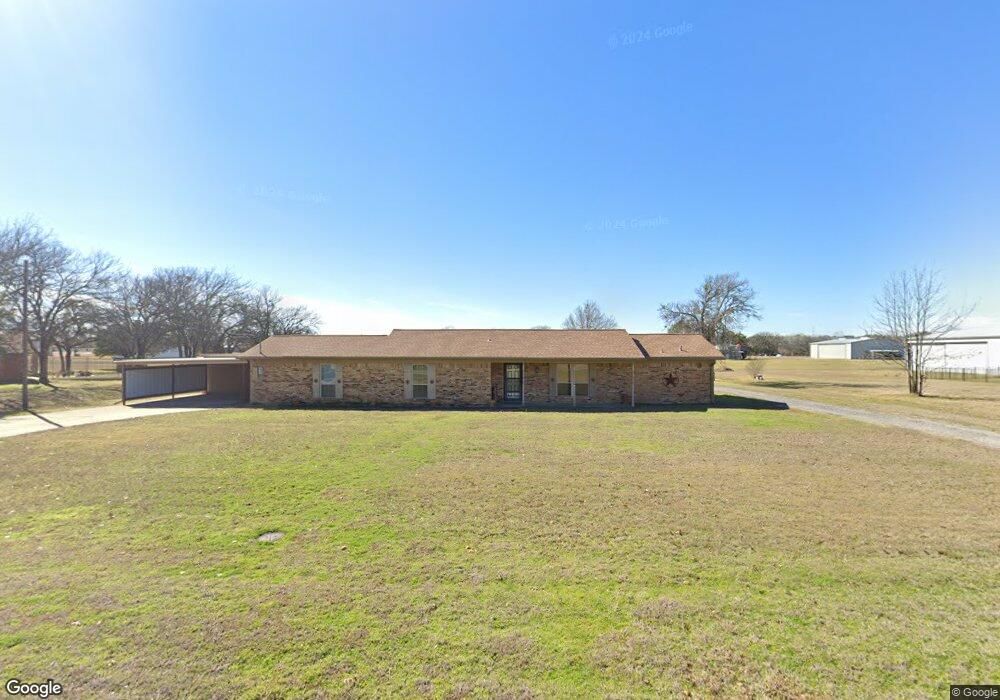
3600 Carla Ct Granbury, TX 76049
Estimated Value: $308,324 - $410,000
--
Bed
--
Bath
1,769
Sq Ft
$208/Sq Ft
Est. Value
About This Home
This home is located at 3600 Carla Ct, Granbury, TX 76049 and is currently estimated at $367,081, approximately $207 per square foot. 3600 Carla Ct is a home located in Hood County with nearby schools including Acton Elementary School, Acton Middle School, and Granbury High School.
Ownership History
Date
Name
Owned For
Owner Type
Purchase Details
Closed on
Apr 20, 2023
Sold by
Firkins Todd and Firkins Holly
Bought by
Ferrara Antonio
Current Estimated Value
Home Financials for this Owner
Home Financials are based on the most recent Mortgage that was taken out on this home.
Original Mortgage
$270,000
Outstanding Balance
$262,398
Interest Rate
6.73%
Mortgage Type
New Conventional
Estimated Equity
$104,683
Purchase Details
Closed on
Nov 15, 2022
Sold by
Kelley Bura Ray
Bought by
Firkins Todd
Purchase Details
Closed on
Mar 24, 2017
Sold by
Polhemus Michael J and Polhemus Deborah L
Bought by
Kelley Bura Ray
Purchase Details
Closed on
Dec 21, 1994
Sold by
Stennett Leland J
Bought by
Kelley Bura Ray
Purchase Details
Closed on
Oct 31, 1985
Sold by
Stennett Leland J
Bought by
Kelley Bura Ray
Create a Home Valuation Report for This Property
The Home Valuation Report is an in-depth analysis detailing your home's value as well as a comparison with similar homes in the area
Home Values in the Area
Average Home Value in this Area
Purchase History
| Date | Buyer | Sale Price | Title Company |
|---|---|---|---|
| Ferrara Antonio | -- | Capital Title | |
| Firkins Todd | -- | Porter Title | |
| Kelley Bura Ray | -- | Central Texas Title Luton | |
| Kelley Bura Ray | -- | -- | |
| Kelley Bura Ray | -- | -- |
Source: Public Records
Mortgage History
| Date | Status | Borrower | Loan Amount |
|---|---|---|---|
| Open | Ferrara Antonio | $270,000 |
Source: Public Records
Tax History Compared to Growth
Tax History
| Year | Tax Paid | Tax Assessment Tax Assessment Total Assessment is a certain percentage of the fair market value that is determined by local assessors to be the total taxable value of land and additions on the property. | Land | Improvement |
|---|---|---|---|---|
| 2025 | $3,888 | $324,190 | $70,000 | $254,190 |
| 2024 | $4,047 | $332,620 | $70,000 | $262,620 |
| 2023 | $3,780 | $310,640 | $70,000 | $240,640 |
| 2022 | $1,374 | $260,560 | $70,000 | $190,560 |
| 2021 | $2,468 | $160,770 | $15,000 | $145,770 |
| 2020 | $2,531 | $162,960 | $15,000 | $147,960 |
| 2019 | $2,650 | $162,990 | $15,000 | $147,990 |
| 2018 | $2,826 | $173,850 | $15,000 | $158,850 |
| 2017 | $1,541 | $140,770 | $15,000 | $125,770 |
| 2016 | $1,401 | $140,790 | $15,000 | $125,790 |
| 2015 | $956 | $133,360 | $15,000 | $118,360 |
| 2014 | $956 | $138,830 | $15,000 | $123,830 |
Source: Public Records
Map
Nearby Homes
- 3901 Upper Lake Cir
- 3521 Nassau Ct
- 549 Tradition Way
- 547 Tradition Way
- 3606 Upper Lake Cir
- 4012 Upper Lake Cir
- 3609 Upper Lake Cir
- 4306 Elmwood Ct
- Lot 189 E Kenwood Ct
- 4504 E Kenwood Ct
- 4506 E Kenwood Ct
- 4312 Rhea Rd
- 4309 Elmwood Ct
- 4404 W Fernwood Ct
- 4313 Cottonwood Ct
- 3809 Winding Way
- 3816 Winding Way
- 4109 Newport Bay Ct
- 3722 Cove Timber Ave
- 4433 Wildwood Cir
- 3532 Carla Ct
- 3603 Carla Ct
- 3604 Carla Ct
- 3605 Carla Ct
- 3609 Carla Ct
- 3612 Carla Ct
- 3613 Carla Ct
- 3525 Carla Ct
- 3605 Nassau Ct
- 3601 Nassau Ct
- 3900 Upper Lake Cir
- 3810 Upper Lake Cir
- 3610 Upper Lake Cir
- 4010 Upper Lake Cir
- 3616 Carla Ct
- 3609 Nassau Ct
- 3710 Upper Lake Cir
- 3712 Upper Lake Cir
- 3706 Upper Lake Cir
- 3521 Carla Ct