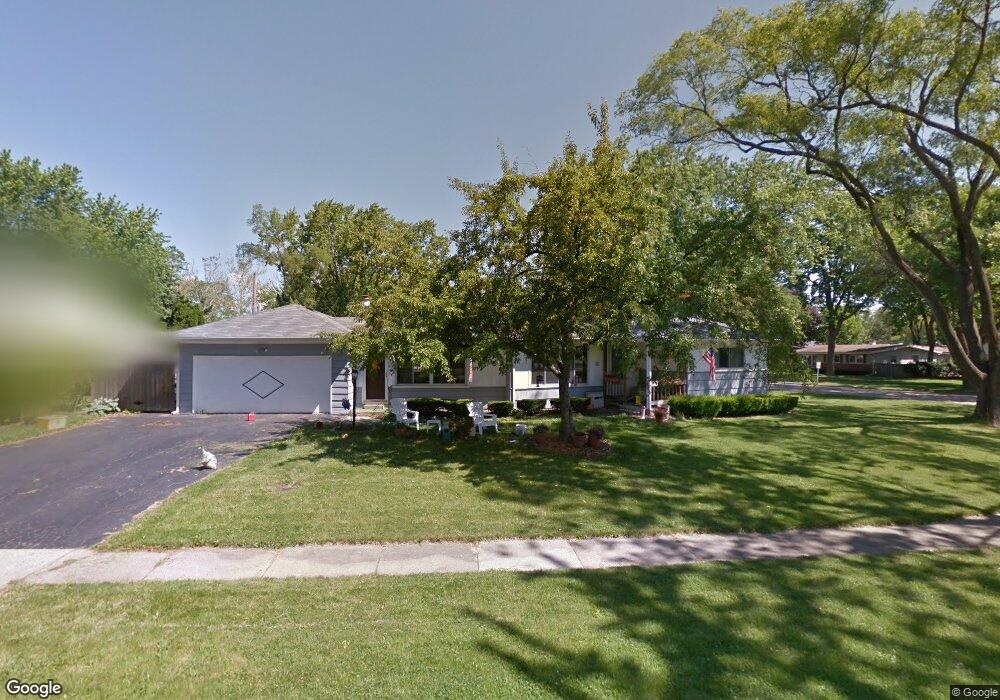
3600 Falcon Ct N Rolling Meadows, IL 60008
Estimated Value: $234,000 - $308,000
3
Beds
1
Bath
1,055
Sq Ft
$266/Sq Ft
Est. Value
About This Home
This home is located at 3600 Falcon Ct N, Rolling Meadows, IL 60008 and is currently estimated at $280,228, approximately $265 per square foot. 3600 Falcon Ct N is a home located in Cook County with nearby schools including Willow Bend Elementary School, Carl Sandburg Junior High School, and Rolling Meadows High School.
Ownership History
Date
Name
Owned For
Owner Type
Purchase Details
Closed on
Dec 12, 2024
Sold by
Berens Rose Marie
Bought by
Moreno Thomas A and Cudney Caroline G
Current Estimated Value
Home Financials for this Owner
Home Financials are based on the most recent Mortgage that was taken out on this home.
Original Mortgage
$223,100
Outstanding Balance
$220,667
Interest Rate
6.63%
Mortgage Type
New Conventional
Estimated Equity
$59,561
Purchase Details
Closed on
Jun 14, 1994
Sold by
Blair Patrick A and Blair Vola D
Bought by
Thiel Carol Ann
Home Financials for this Owner
Home Financials are based on the most recent Mortgage that was taken out on this home.
Original Mortgage
$80,000
Interest Rate
8.78%
Create a Home Valuation Report for This Property
The Home Valuation Report is an in-depth analysis detailing your home's value as well as a comparison with similar homes in the area
Home Values in the Area
Average Home Value in this Area
Purchase History
| Date | Buyer | Sale Price | Title Company |
|---|---|---|---|
| Moreno Thomas A | $230,000 | First American Title | |
| Moreno Thomas A | $230,000 | First American Title | |
| Thiel Carol Ann | $127,000 | Attorneys Title Guaranty Fun |
Source: Public Records
Mortgage History
| Date | Status | Borrower | Loan Amount |
|---|---|---|---|
| Open | Moreno Thomas A | $223,100 | |
| Closed | Moreno Thomas A | $223,100 | |
| Previous Owner | Thiel Carol Ann | $80,000 |
Source: Public Records
Tax History
| Year | Tax Paid | Tax Assessment Tax Assessment Total Assessment is a certain percentage of the fair market value that is determined by local assessors to be the total taxable value of land and additions on the property. | Land | Improvement |
|---|---|---|---|---|
| 2025 | $2,680 | $28,000 | $5,932 | $22,068 |
| 2024 | $2,680 | $22,000 | $5,019 | $16,981 |
| 2023 | $2,647 | $22,000 | $5,019 | $16,981 |
| 2022 | $2,647 | $22,000 | $5,019 | $16,981 |
| 2021 | $2,909 | $19,923 | $2,965 | $16,958 |
| 2020 | $2,646 | $19,923 | $2,965 | $16,958 |
| 2019 | $2,631 | $22,261 | $2,965 | $19,296 |
| 2018 | $2,934 | $19,443 | $2,737 | $16,706 |
| 2017 | $2,824 | $19,443 | $2,737 | $16,706 |
| 2016 | $3,414 | $19,443 | $2,737 | $16,706 |
| 2015 | $3,820 | $16,668 | $2,509 | $14,159 |
| 2014 | $3,651 | $16,668 | $2,509 | $14,159 |
| 2013 | $3,084 | $16,668 | $2,509 | $14,159 |
Source: Public Records
Map
Nearby Homes
- 3345 Kirchoff Rd Unit 5C
- 3265 Kirchoff Rd Unit 116
- 3135 Town Square Dr Unit 401
- 3135 Town Square Dr Unit 104
- 3100 Town Square Dr Unit 308
- 3100 Town Square Dr Unit 204
- 3 Holyoke on Auburn
- 2600 Brookwood Way Dr Unit 316
- 2600 Brookwood Way Dr Unit 305
- 399 Knollwood Ct
- 3200 Thrush Ln
- 2650 Brookwood Way Dr Unit 313
- 2650 Brookwood Way Dr Unit 108
- 2401 Rohlwing Rd
- 3306 Trillium Cir Unit 3001
- 3209 Trillium Cir
- 2705 Park St
- 2709 Lily Ln
- 304 E Tall Trees Ln
- 3000 California Ave
Your Personal Tour Guide
Ask me questions while you tour the home.