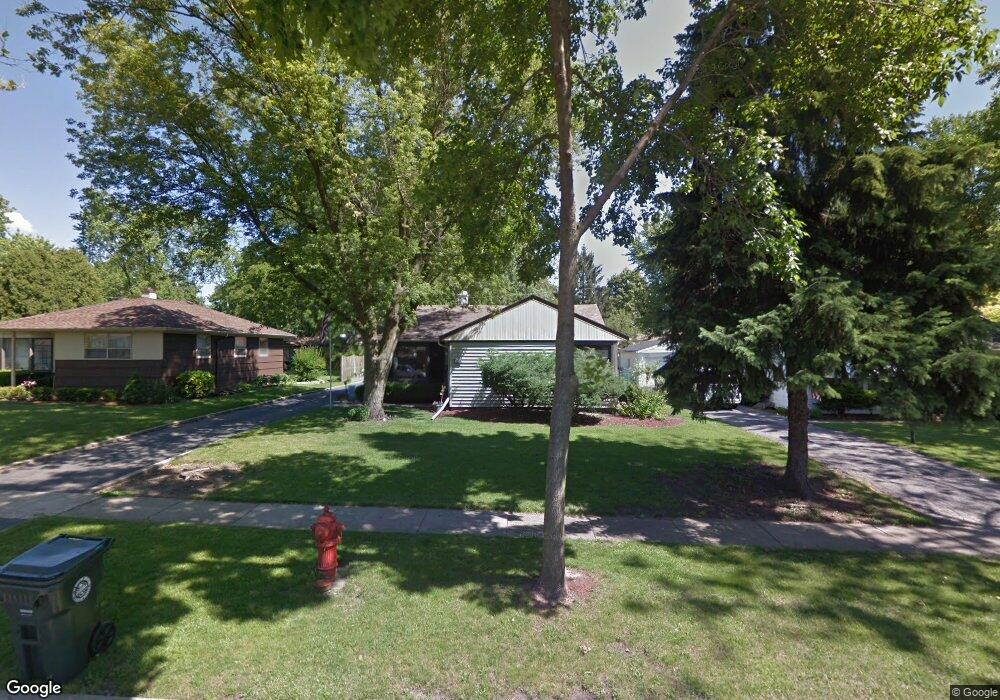
3600 Falcon Ct S Rolling Meadows, IL 60008
Estimated Value: $307,000 - $328,064
3
Beds
2
Baths
1,055
Sq Ft
$300/Sq Ft
Est. Value
About This Home
This home is located at 3600 Falcon Ct S, Rolling Meadows, IL 60008 and is currently estimated at $317,016, approximately $300 per square foot. 3600 Falcon Ct S is a home located in Cook County with nearby schools including Willow Bend Elementary School, Carl Sandburg Junior High School, and Rolling Meadows High School.
Ownership History
Date
Name
Owned For
Owner Type
Purchase Details
Closed on
Feb 11, 2016
Sold by
Schweda Pamela M
Bought by
Schweda Pamela M and The Pamela M Schweda Trust
Current Estimated Value
Purchase Details
Closed on
Feb 2, 2007
Sold by
Schweda Frank A and Schweda Pamela M
Bought by
Schweda Frank A and Schweda Pamela M
Purchase Details
Closed on
Jul 16, 2004
Sold by
Walsh James E and Walsh Donna M
Bought by
Han Moon Gi
Home Financials for this Owner
Home Financials are based on the most recent Mortgage that was taken out on this home.
Original Mortgage
$174,000
Outstanding Balance
$94,860
Interest Rate
7.99%
Mortgage Type
Unknown
Estimated Equity
$222,156
Create a Home Valuation Report for This Property
The Home Valuation Report is an in-depth analysis detailing your home's value as well as a comparison with similar homes in the area
Home Values in the Area
Average Home Value in this Area
Purchase History
| Date | Buyer | Sale Price | Title Company |
|---|---|---|---|
| Schweda Pamela M | -- | Attorney | |
| Schweda Frank A | -- | None Available | |
| Han Moon Gi | $220,000 | Lawyers Title Ins |
Source: Public Records
Mortgage History
| Date | Status | Borrower | Loan Amount |
|---|---|---|---|
| Open | Han Moon Gi | $174,000 | |
| Closed | Han Moon Gi | $44,000 |
Source: Public Records
Tax History
| Year | Tax Paid | Tax Assessment Tax Assessment Total Assessment is a certain percentage of the fair market value that is determined by local assessors to be the total taxable value of land and additions on the property. | Land | Improvement |
|---|---|---|---|---|
| 2025 | $6,340 | $30,000 | $5,070 | $24,930 |
| 2024 | $6,340 | $24,000 | $4,290 | $19,710 |
| 2023 | $6,040 | $24,000 | $4,290 | $19,710 |
| 2022 | $6,040 | $24,000 | $4,290 | $19,710 |
| 2021 | $5,408 | $19,660 | $2,535 | $17,125 |
| 2020 | $5,354 | $19,660 | $2,535 | $17,125 |
| 2019 | $5,393 | $21,967 | $2,535 | $19,432 |
| 2018 | $5,722 | $21,101 | $2,340 | $18,761 |
| 2017 | $5,624 | $21,101 | $2,340 | $18,761 |
| 2016 | $5,499 | $21,101 | $2,340 | $18,761 |
| 2015 | $5,149 | $18,978 | $2,145 | $16,833 |
| 2014 | $5,043 | $18,978 | $2,145 | $16,833 |
| 2013 | $4,904 | $18,978 | $2,145 | $16,833 |
Source: Public Records
Map
Nearby Homes
- 3345 Kirchoff Rd Unit 5C
- 3265 Kirchoff Rd Unit 116
- 3135 Town Square Dr Unit 401
- 3135 Town Square Dr Unit 104
- 399 Knollwood Ct
- 3 Holyoke on Auburn
- 3100 Town Square Dr Unit 308
- 3100 Town Square Dr Unit 204
- 3200 Thrush Ln
- 3306 Trillium Cir Unit 3001
- 3209 Trillium Cir
- 2600 Brookwood Way Dr Unit 316
- 2600 Brookwood Way Dr Unit 305
- 2650 Brookwood Way Dr Unit 313
- 2650 Brookwood Way Dr Unit 108
- 2709 Lily Ln
- 2705 Park St
- 2401 Rohlwing Rd
- 304 E Tall Trees Ln
- 3000 California Ave
- 3504 Falcon Ct S
- 3605 Finch Ct
- 3604 Falcon Ct S
- 3502 Falcon Ct S
- 3607 Finch Ct
- 3603 Finch Ct
- 3603 Falcon Ct S
- 3601 Falcon Ct S
- 3605 Falcon Ct S
- 3606 Falcon Ct S
- 3105 Owl Dr
- 3505 Falcon Ct S
- 3500 Falcon Ct S
- 3104 Falcon Ct W
- 3103 Owl Dr
- 3607 Falcon Ct S
- 3503 Falcon Ct S
- 3102 Falcon Ct W
- 3606 Finch Ct
- 3601 Finch Ct
Your Personal Tour Guide
Ask me questions while you tour the home.