Estimated Value: $307,000 - $365,431
3
Beds
2
Baths
1,430
Sq Ft
$241/Sq Ft
Est. Value
About This Home
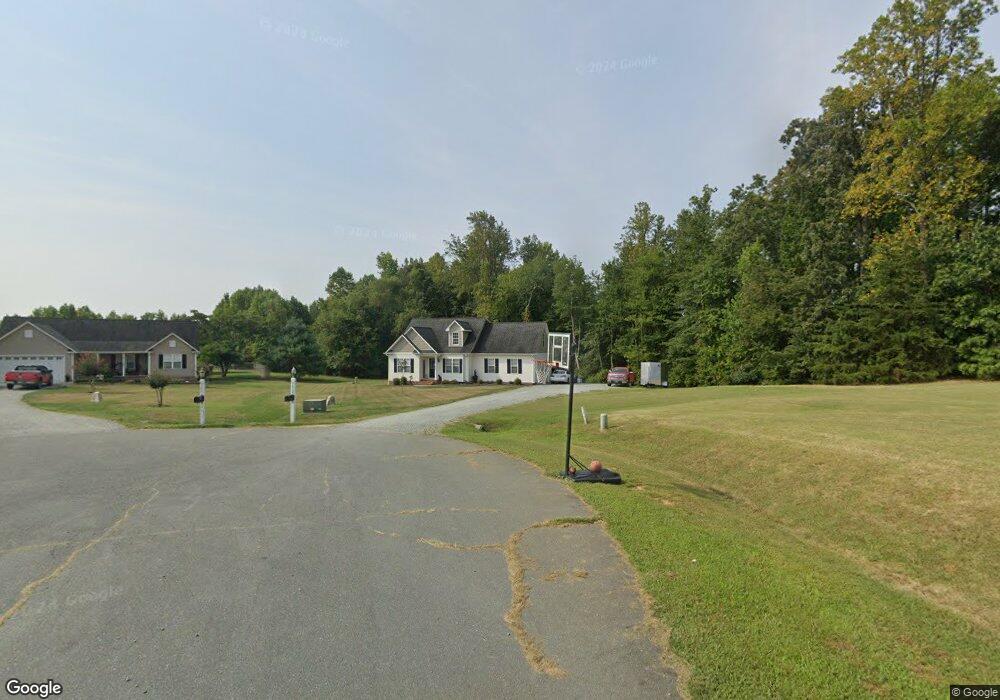
This home is located at 3600 Lukes Ct, Elon, NC 27244 and is currently estimated at $344,358, approximately $240 per square foot. 3600 Lukes Ct is a home located in Alamance County with nearby schools including Altamahaw Ossipee Elementary School, Western Alamance Middle School, and Western Alamance High School.
Ownership History
Date
Name
Owned For
Owner Type
Purchase Details
Closed on
Oct 27, 2014
Sold by
The Bank Of New York Mellon
Bought by
Hill Kenneth L
Current Estimated Value
Home Financials for this Owner
Home Financials are based on the most recent Mortgage that was taken out on this home.
Original Mortgage
$133,546
Outstanding Balance
$100,380
Interest Rate
3.5%
Mortgage Type
FHA
Estimated Equity
$243,978
Purchase Details
Closed on
Aug 4, 2014
Sold by
Ingle Sub Tr Grady I and Brown Michael
Bought by
The Bank Of New York Mellon
Purchase Details
Closed on
Apr 28, 2005
Sold by
H And W Builders Inc
Bought by
Brown Michael T
Home Financials for this Owner
Home Financials are based on the most recent Mortgage that was taken out on this home.
Original Mortgage
$150,000
Interest Rate
5.88%
Mortgage Type
New Conventional
Create a Home Valuation Report for This Property
The Home Valuation Report is an in-depth analysis detailing your home's value as well as a comparison with similar homes in the area
Home Values in the Area
Average Home Value in this Area
Purchase History
| Date | Buyer | Sale Price | Title Company |
|---|---|---|---|
| Hill Kenneth L | $142,000 | -- | |
| The Bank Of New York Mellon | $119,000 | -- | |
| Brown Michael T | $150,000 | -- |
Source: Public Records
Mortgage History
| Date | Status | Borrower | Loan Amount |
|---|---|---|---|
| Open | Hill Kenneth L | $133,546 | |
| Previous Owner | Brown Michael T | $150,000 |
Source: Public Records
Tax History Compared to Growth
Tax History
| Year | Tax Paid | Tax Assessment Tax Assessment Total Assessment is a certain percentage of the fair market value that is determined by local assessors to be the total taxable value of land and additions on the property. | Land | Improvement |
|---|---|---|---|---|
| 2025 | $1,849 | $301,127 | $57,762 | $243,365 |
| 2024 | $1,713 | $301,127 | $57,762 | $243,365 |
| 2023 | $1,594 | $301,127 | $57,762 | $243,365 |
| 2022 | $1,197 | $152,272 | $41,481 | $110,791 |
| 2021 | $1,212 | $152,272 | $41,481 | $110,791 |
| 2020 | $1,227 | $152,272 | $41,481 | $110,791 |
| 2019 | $1,233 | $152,272 | $41,481 | $110,791 |
| 2018 | $0 | $152,272 | $41,481 | $110,791 |
| 2017 | $1,096 | $152,272 | $41,481 | $110,791 |
| 2016 | $1,203 | $172,461 | $37,147 | $135,314 |
| 2015 | $1,197 | $172,461 | $37,147 | $135,314 |
| 2014 | $1,111 | $172,461 | $37,147 | $135,314 |
Source: Public Records
Map
Nearby Homes
- 2856 Gwyn Rd
- 0 Walker Rd Unit 128719
- 0 Walker Rd Unit 1121878
- 3163 Saul Loop Rd
- 3307 Altamahaw Church St
- 2671 Lenore Dr
- Lots 11-14 Lenore Dr
- 6033 David Moore Rd
- 6117 David Moore Rd
- 2484 Moss Creek Loop
- 2858 Stoney Creek Church Rd
- 4731 Pagetown Rd
- 3437 Shepherd Rd Unit 14
- 2201 Broken Arrow Ln
- 2816 Ricolden Trail
- 2812 Ricolden Trail
- 2808 Ricolden Trail
- 0 Pagetown Rd Unit 10118316
- 2119 Northcrest Dr
- 6418 Osceola Ossipee Rd
- 3600 Lukes Ct
- 3601 Lukes Ct
- 3608 Lukes Ct
- 3603 Lukes Ct
- 3607 Lukes Ct
- 3620 Lukes Ct
- 3617 Lukes Ct
- 3630 Lukes Ct
- 3629 Lukes Ct
- 0 Altamahaw Race Track Rd Unit 1942784
- 0 Altamahaw Race Track Rd Unit 703715
- 0 Altamahaw Race Track Rd Unit 13 TR1942784
- 3630 Lukes Ct
- Lot 1 Altamahaw Race Track Rd
- Lot 1 Altamahaw Race Track Rd Unit 1
- 3553 Altamahaw Race Track Rd
- 3644 Lukes Ct
- 3645 Lukes Ct
- 3122 Gwynn Rd
- 3661 Lukes Ct