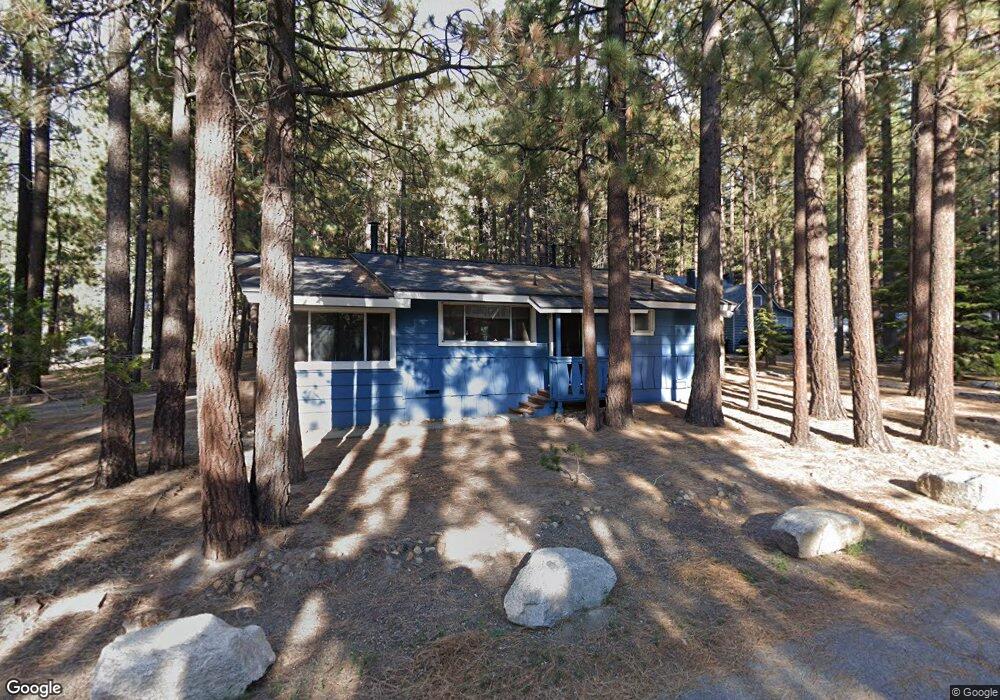
3600 Paradise Ave South Lake Tahoe, NV 96150
Estimated Value: $408,000 - $536,769
2
Beds
1
Bath
960
Sq Ft
$502/Sq Ft
Est. Value
About This Home
This home is located at 3600 Paradise Ave, South Lake Tahoe, NV 96150 and is currently estimated at $481,442, approximately $501 per square foot. 3600 Paradise Ave is a home located in El Dorado County with nearby schools including Bijou Community, South Tahoe Middle School, and South Tahoe High School.
Ownership History
Date
Name
Owned For
Owner Type
Purchase Details
Closed on
Jan 4, 2023
Sold by
Lai Tinman
Bought by
Clamp Stephen
Current Estimated Value
Home Financials for this Owner
Home Financials are based on the most recent Mortgage that was taken out on this home.
Original Mortgage
$414,200
Outstanding Balance
$400,965
Interest Rate
6.42%
Mortgage Type
New Conventional
Estimated Equity
$80,477
Purchase Details
Closed on
Mar 8, 2010
Sold by
Beck Linda C and The Lonnie R Beck Separate Pro
Bought by
Lai Tinman
Purchase Details
Closed on
Oct 31, 2008
Sold by
Beck Linda C
Bought by
Beck Linda C and Beck Separate Propert Lonnie R
Purchase Details
Closed on
Dec 30, 1993
Sold by
Montalbano Joseph and Montalbano Victoria
Bought by
Beck Lonnie R and Beck Linda C
Create a Home Valuation Report for This Property
The Home Valuation Report is an in-depth analysis detailing your home's value as well as a comparison with similar homes in the area
Home Values in the Area
Average Home Value in this Area
Purchase History
| Date | Buyer | Sale Price | Title Company |
|---|---|---|---|
| Clamp Stephen | $436,000 | Placer Title | |
| Lai Tinman | $210,000 | Old Republic Title Company | |
| Beck Linda C | -- | None Available | |
| Beck Lonnie R | $117,000 | First American Title Co |
Source: Public Records
Mortgage History
| Date | Status | Borrower | Loan Amount |
|---|---|---|---|
| Open | Clamp Stephen | $414,200 |
Source: Public Records
Tax History Compared to Growth
Tax History
| Year | Tax Paid | Tax Assessment Tax Assessment Total Assessment is a certain percentage of the fair market value that is determined by local assessors to be the total taxable value of land and additions on the property. | Land | Improvement |
|---|---|---|---|---|
| 2025 | $5,806 | $375,584 | $78,030 | $297,554 |
| 2024 | $5,806 | $368,220 | $76,500 | $291,720 |
| 2023 | $2,112 | $189,806 | $68,229 | $121,577 |
| 2022 | $2,091 | $186,086 | $66,892 | $119,194 |
| 2021 | $2,059 | $182,438 | $65,581 | $116,857 |
| 2020 | $2,030 | $180,568 | $64,909 | $115,659 |
| 2019 | $2,020 | $177,029 | $63,637 | $113,392 |
| 2018 | $1,976 | $173,559 | $62,390 | $111,169 |
| 2017 | $1,946 | $170,157 | $61,167 | $108,990 |
| 2016 | $1,907 | $166,821 | $59,968 | $106,853 |
| 2015 | $1,812 | $164,317 | $59,068 | $105,249 |
| 2014 | $1,812 | $161,101 | $57,912 | $103,189 |
Source: Public Records
Map
Nearby Homes
- 3608 Aspen Ave
- 1160 Bowers Ave
- 3535 Lake Tahoe Blvd Unit 130
- 3535 Lake Tahoe Blvd Unit 231
- 3535 Lake Tahoe Blvd Unit 623
- 3535 Lake Tahoe Blvd Unit 506
- 3535 Lake Tahoe Blvd Unit 499
- 3535 Lake Tahoe Blvd Unit 329
- 3535 Lake Tahoe Blvd Unit 313
- 3535 Lake Tahoe Blvd Unit 131
- 3508 Fawn Way
- 3520 Cloverdale Ave
- 1115 Glenwood Way
- 1151 Herbert Ave Unit B
- 1181 Ski Run Blvd
- 3696 Birch Ave
- 3680 Tamarack Ave
- 1152 Sonora Ave
- 920 Balbijou Rd Unit 229
- 1022 Fairway Ave
- 3600 Paradise Ave
- 3601 Forest Ave
- 3612 Bill Ave
- 3612 Paradise Ave
- 3607 Bill Ave
- 3601 Paradise Ave
- 3605 Paradise Ave
- 3609 Forest Ave
- 3609 Paradise Ave Unit A
- 3609 Paradise Ave
- 3613 Shirley Ave
- 3600 Forest Ave
- 3604 Forest Ave
- 3609 Shirley Ave
- 3613 Paradise Ave Unit A-B
- 3613 Paradise Ave Unit A
- 3601 Bill Ave
- 3606 Forest Ave
- 3600 Bill Ave
- 3605 Shirley Ave