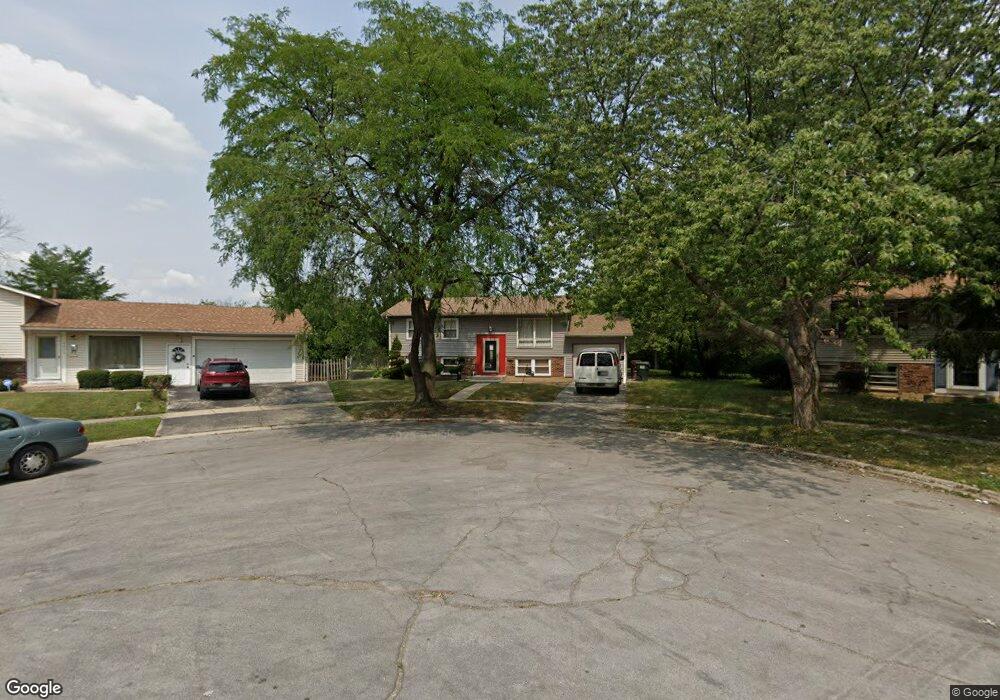
3600 Peach Grove Ln Hazel Crest, IL 60429
Estimated Value: $161,000 - $213,000
3
Beds
2
Baths
918
Sq Ft
$213/Sq Ft
Est. Value
About This Home
This home is located at 3600 Peach Grove Ln, Hazel Crest, IL 60429 and is currently estimated at $195,526, approximately $212 per square foot. 3600 Peach Grove Ln is a home located in Cook County with nearby schools including Highlands Elementary School, Prairie-Hills Junior High School, and Hillcrest High School.
Ownership History
Date
Name
Owned For
Owner Type
Purchase Details
Closed on
Feb 27, 2012
Sold by
English Lorna M
Bought by
Chicago Title Land Trust Company and Trust #8002358513
Current Estimated Value
Purchase Details
Closed on
Sep 25, 2006
Sold by
Washington Donna
Bought by
English Lorna M
Home Financials for this Owner
Home Financials are based on the most recent Mortgage that was taken out on this home.
Original Mortgage
$136,000
Interest Rate
9.15%
Mortgage Type
Unknown
Purchase Details
Closed on
Feb 2, 2000
Sold by
Miggins Thomas
Bought by
Mccaskill Taroza
Home Financials for this Owner
Home Financials are based on the most recent Mortgage that was taken out on this home.
Original Mortgage
$106,200
Interest Rate
11.13%
Purchase Details
Closed on
Mar 27, 1995
Sold by
Murry David Earl and Murry Gloria V
Bought by
Miggins Thomas
Create a Home Valuation Report for This Property
The Home Valuation Report is an in-depth analysis detailing your home's value as well as a comparison with similar homes in the area
Home Values in the Area
Average Home Value in this Area
Purchase History
| Date | Buyer | Sale Price | Title Company |
|---|---|---|---|
| Chicago Title Land Trust Company | $40,000 | Fidelity National Title | |
| English Lorna M | $160,000 | Xpress Title Services Inc | |
| Mccaskill Taroza | $118,000 | Intercounty Title | |
| Miggins Thomas | -- | -- |
Source: Public Records
Mortgage History
| Date | Status | Borrower | Loan Amount |
|---|---|---|---|
| Previous Owner | English Lorna M | $136,000 | |
| Previous Owner | Mccaskill Taroza | $106,200 | |
| Closed | Mccaskill Taroza | $106,200 |
Source: Public Records
Tax History Compared to Growth
Tax History
| Year | Tax Paid | Tax Assessment Tax Assessment Total Assessment is a certain percentage of the fair market value that is determined by local assessors to be the total taxable value of land and additions on the property. | Land | Improvement |
|---|---|---|---|---|
| 2024 | $5,041 | $12,368 | $4,088 | $8,280 |
| 2023 | $4,585 | $13,156 | $4,088 | $9,068 |
| 2022 | $4,585 | $9,666 | $3,504 | $6,162 |
| 2021 | $4,482 | $9,665 | $3,504 | $6,161 |
| 2020 | $4,408 | $9,665 | $3,504 | $6,161 |
| 2019 | $3,638 | $8,863 | $3,212 | $5,651 |
| 2018 | $3,522 | $8,863 | $3,212 | $5,651 |
| 2017 | $3,327 | $8,863 | $3,212 | $5,651 |
| 2016 | $3,223 | $8,010 | $2,920 | $5,090 |
| 2015 | $3,017 | $8,010 | $2,920 | $5,090 |
| 2014 | $2,973 | $8,010 | $2,920 | $5,090 |
| 2013 | $4,312 | $9,004 | $2,920 | $6,084 |
Source: Public Records
Map
Nearby Homes
- 3512 Woodworth Place
- 3618 Peach Grove Ln
- 17316 Central Park Ave
- 17303 Appletree Dr
- 3500 Maple Ln
- 17206 Elm Dr
- 3806 172nd St
- 3800 171st St
- 17004 Locust Dr
- 17113 Elm Dr
- 3317 Woodworth Place
- 3881 171st St
- 3509 Birchwood Dr
- 3312 Maple Ln
- 3324 Laurel Ln
- 17306 Burr Oak Ln
- 17126 Orchard Ln
- 3425 Birchwood Dr
- 17007 Elm Dr
- 17311 Burr Oak Ln
- 17201 Springtide Ln
- 3602 Peach Grove Ln
- 3601 Laurel Ln
- 17206 Central Park Ave
- 17208 Central Park Ave
- 17210 Central Park Ave
- 3603 Laurel Ln
- 3604 Peach Grove Ln
- 17203 Springtide Ln
- 17204 Central Park Ave
- 17212 Central Park Ave
- 3605 Laurel Ln
- 3606 Peach Grove Ln
- 17214 Central Park Ave
- 17205 Springtide Ln
- 3605 Peach Grove Ln
- 3607 Laurel Ln
- 3607 Peach Grove Ln
- 3608 Peach Grove Ln
- 17300 Central Park Ave