Estimated Value: $596,366 - $655,000
4
Beds
4
Baths
4,585
Sq Ft
$136/Sq Ft
Est. Value
About This Home
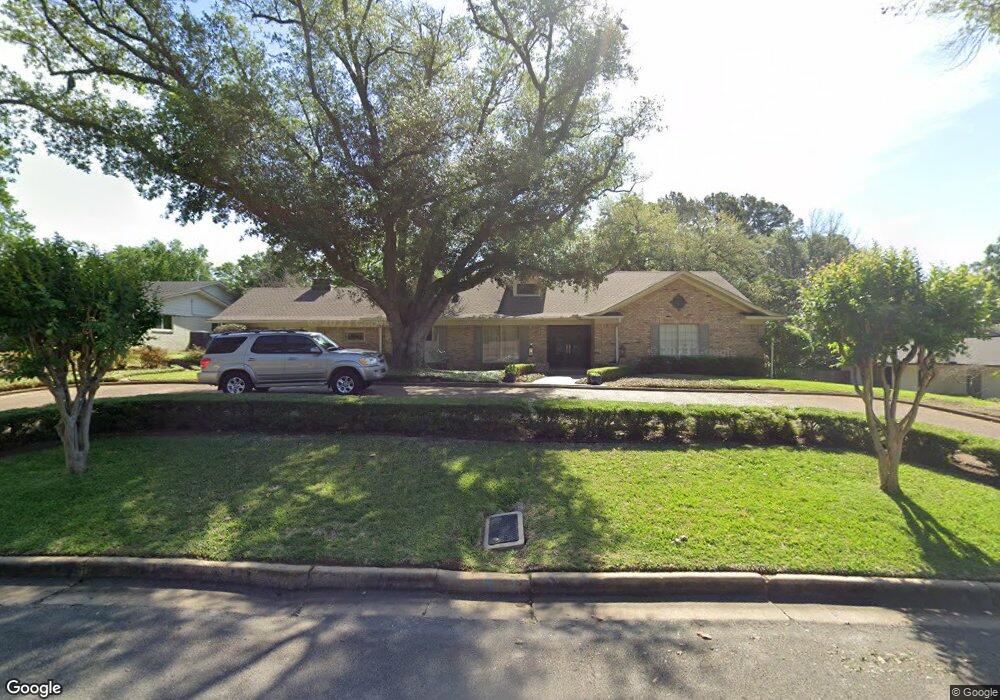
This home is located at 3600 Wynnwood Dr, Tyler, TX 75701 and is currently estimated at $623,842, approximately $136 per square foot. 3600 Wynnwood Dr is a home located in Smith County with nearby schools including Woods Elementary School, Hubbard Middle School, and Tyler Legacy High School.
Ownership History
Date
Name
Owned For
Owner Type
Purchase Details
Closed on
Sep 12, 2022
Sold by
Breedlove and Bromli
Bought by
Dougherty Thomas and Dougherty Mallory
Current Estimated Value
Home Financials for this Owner
Home Financials are based on the most recent Mortgage that was taken out on this home.
Original Mortgage
$583,200
Outstanding Balance
$553,824
Interest Rate
4.88%
Mortgage Type
New Conventional
Estimated Equity
$70,018
Purchase Details
Closed on
Aug 6, 2018
Sold by
Thomas Patrick R and Thomas Patrick R
Bought by
Breedlove Barrett and Breedlove Bromli
Home Financials for this Owner
Home Financials are based on the most recent Mortgage that was taken out on this home.
Original Mortgage
$264,000
Interest Rate
4.5%
Mortgage Type
New Conventional
Create a Home Valuation Report for This Property
The Home Valuation Report is an in-depth analysis detailing your home's value as well as a comparison with similar homes in the area
Home Values in the Area
Average Home Value in this Area
Purchase History
| Date | Buyer | Sale Price | Title Company |
|---|---|---|---|
| Dougherty Thomas | -- | -- | |
| Breedlove Barrett | -- | None Available |
Source: Public Records
Mortgage History
| Date | Status | Borrower | Loan Amount |
|---|---|---|---|
| Open | Dougherty Thomas | $583,200 | |
| Previous Owner | Breedlove Barrett | $264,000 |
Source: Public Records
Tax History Compared to Growth
Tax History
| Year | Tax Paid | Tax Assessment Tax Assessment Total Assessment is a certain percentage of the fair market value that is determined by local assessors to be the total taxable value of land and additions on the property. | Land | Improvement |
|---|---|---|---|---|
| 2025 | $9,112 | $597,563 | $37,450 | $560,113 |
| 2024 | $9,112 | $597,563 | $37,450 | $560,113 |
| 2023 | $11,083 | $635,781 | $37,450 | $598,331 |
| 2022 | $7,936 | $472,375 | $32,100 | $440,275 |
| 2021 | $7,726 | $368,251 | $32,100 | $336,151 |
| 2020 | $7,166 | $334,871 | $32,100 | $302,771 |
| 2019 | $6,626 | $328,817 | $21,400 | $307,417 |
| 2018 | $8,069 | $371,004 | $21,400 | $349,604 |
| 2017 | $7,927 | $371,313 | $21,400 | $349,913 |
| 2016 | $7,613 | $356,587 | $16,820 | $339,767 |
| 2015 | $3,875 | $338,526 | $16,820 | $321,706 |
| 2014 | $3,875 | $351,467 | $16,820 | $334,647 |
Source: Public Records
Map
Nearby Homes
- 3712 Colony Park Dr
- 3710 Bain Place
- 3511 S Keaton Ave
- 4021 New Copeland Rd
- 3210 S Donnybrook Ave
- 3202 S Donnybrook Ave
- 3523 S Cameron Ave
- 1113 E Amherst Dr
- 1018 Pollard Dr
- 1107 Pinedale Place
- 1408 Westfield St
- 315 Ridgecrest Dr
- 1101 Clyde Dr
- 1505 Glenrose St
- 611 E Watkins St
- 1024 Clyde Dr
- 905 E Watkins St
- 3235 Curtis Dr
- 3006 de Charles St
- 204 Ridgecrest Dr
- 3600 3600 Wynnwood Dr
- 3524 3524 Wynnwood Dr
- 3610 Wynnwood Dr
- 3524 Wynnwood Dr
- 3601 3601 Bain
- 3520 Wynnwood Dr
- 3525 Bain Place
- 3611 Bain Place
- 3537 3537 Wynnwood
- 3533 Wynnwood Dr
- 3529 Wynnwood Dr
- 3537 Wynnwood Dr
- 3521 Bain Place
- 3618 Wynnwood Dr
- 3618 3618 Wynnwood Dr
- 3521 3521 Wynnwood Dr
- 3521 Wynnwood Dr
- 3512 Wynnwood Dr
- 3701 Bain Place