Estimated Value: $231,000 - $265,000
3
Beds
2
Baths
1,662
Sq Ft
$148/Sq Ft
Est. Value
About This Home
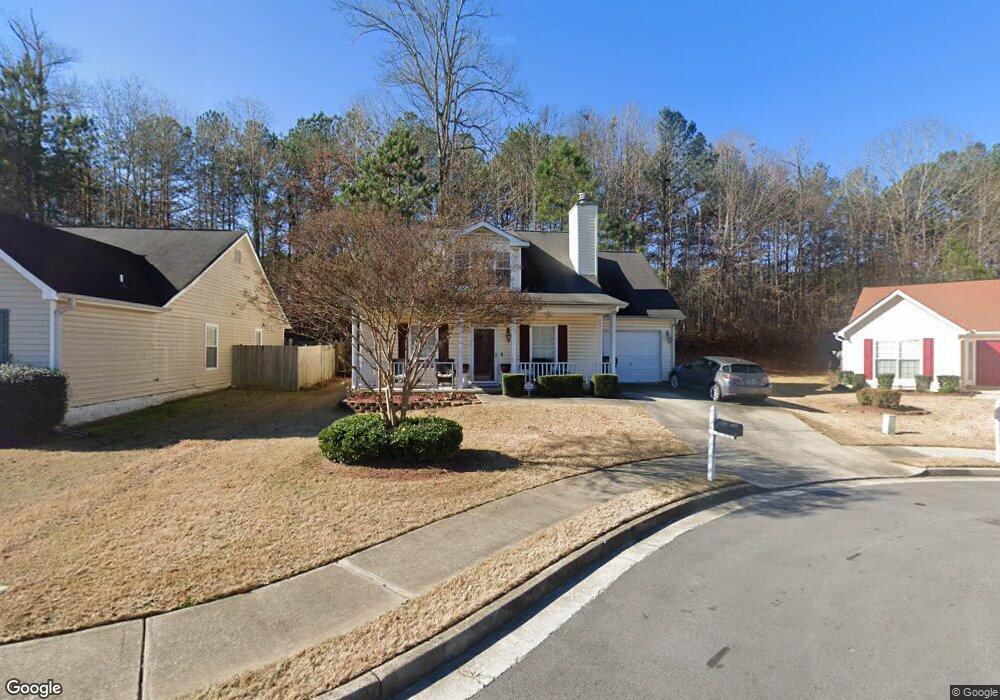
This home is located at 3601 Bristol Overlook Unit 6, Rex, GA 30273 and is currently estimated at $245,941, approximately $147 per square foot. 3601 Bristol Overlook Unit 6 is a home located in Clayton County with nearby schools including Roberta T. Smith Elementary School, Rex Mill Middle School, and Mount Zion High School.
Ownership History
Date
Name
Owned For
Owner Type
Purchase Details
Closed on
Jun 11, 2010
Sold by
Hud-Housing Of Urban Dev
Bought by
Powell Mary A
Current Estimated Value
Purchase Details
Closed on
Feb 2, 2010
Sold by
Wells Fargo Bk Na
Bought by
Hud-Housing Of Urban Dev
Purchase Details
Closed on
Dec 20, 2004
Sold by
Burch-Furno Miriam M
Bought by
Furno Miriam M and Furno Stepen
Home Financials for this Owner
Home Financials are based on the most recent Mortgage that was taken out on this home.
Original Mortgage
$117,991
Interest Rate
5.61%
Mortgage Type
VA
Purchase Details
Closed on
Nov 6, 2001
Sold by
Knight Group Inc
Bought by
Burch-Furno Miriam M
Home Financials for this Owner
Home Financials are based on the most recent Mortgage that was taken out on this home.
Original Mortgage
$114,653
Interest Rate
6.67%
Mortgage Type
FHA
Create a Home Valuation Report for This Property
The Home Valuation Report is an in-depth analysis detailing your home's value as well as a comparison with similar homes in the area
Home Values in the Area
Average Home Value in this Area
Purchase History
| Date | Buyer | Sale Price | Title Company |
|---|---|---|---|
| Powell Mary A | -- | -- | |
| Hud-Housing Of Urban Dev | -- | -- | |
| Wells Fargo Bk Na | $120,200 | -- | |
| Furno Miriam M | -- | -- | |
| Burch-Furno Miriam M | $115,600 | -- |
Source: Public Records
Mortgage History
| Date | Status | Borrower | Loan Amount |
|---|---|---|---|
| Previous Owner | Furno Miriam M | $117,991 | |
| Previous Owner | Burch-Furno Miriam M | $114,653 |
Source: Public Records
Tax History Compared to Growth
Tax History
| Year | Tax Paid | Tax Assessment Tax Assessment Total Assessment is a certain percentage of the fair market value that is determined by local assessors to be the total taxable value of land and additions on the property. | Land | Improvement |
|---|---|---|---|---|
| 2025 | $4,027 | $104,160 | $8,800 | $95,360 |
| 2024 | $3,981 | $101,080 | $8,800 | $92,280 |
| 2023 | $3,370 | $92,280 | $8,800 | $83,480 |
| 2022 | $2,853 | $71,720 | $8,800 | $62,920 |
| 2021 | $2,345 | $58,400 | $8,800 | $49,600 |
| 2020 | $2,045 | $50,176 | $8,800 | $41,376 |
| 2019 | $1,845 | $44,508 | $6,400 | $38,108 |
| 2018 | $1,518 | $36,463 | $6,400 | $30,063 |
| 2017 | $1,280 | $30,511 | $6,400 | $24,111 |
| 2016 | $1,057 | $25,981 | $6,400 | $19,581 |
| 2015 | $1,266 | $0 | $0 | $0 |
| 2014 | $978 | $24,590 | $6,400 | $18,190 |
Source: Public Records
Map
Nearby Homes
- 3601 Bristol Overlook
- 3700 Hudson Ct
- 3535 Henley St
- 6891 Dresden Dr
- 7027 Biscayne Blvd
- 6870 Diamond Dr
- 0 Lakeland Rd Unit 7648836
- 0 Lakeland Rd Unit 10603417
- 3552 Topaz Terrace
- 7106 Oakwood Cir Unit 1
- 6674 Sunset Valley Cir
- 3403 Hidden Ln
- 6750 Sunset Hills Blvd
- 6716 Teresa Ln
- 6603 Biscayne Blvd
- 6646 Creek Turn Dr
- 6710 Sunset Hills Blvd
- 3374 Creekwood Dr
- 3315 Canterbury Trail
- 3307 Canterbury Trail
- 3607 Bristol Overlook
- 3597 Bristol Overlook Unit 6
- 3613 Bristol Overlook Unit 6
- 3593 Bristol Overlook Unit 6
- 3602 Bristol Overlook Unit 6
- 3619 Bristol Overlook
- 3610 Bristol Overlook
- 3594 Bristol Overlook
- 3598 Bristol Overlook
- 3616 Bristol Overlook Unit 6
- 3616 Bristol Overlook
- 3625 Bristol Overlook Unit 6
- 3626 Bristol Overlook
- 3634 Bristol Overlook Unit 6
- 3631 Bristol Overlook Unit 6
- 3644 Bristol Overlook Unit 6
- 3637 Bristol Overlook Unit 6
- 3650 Bristol Overlook
- 3643 Bristol Overlook
- 3660 Hudson Way