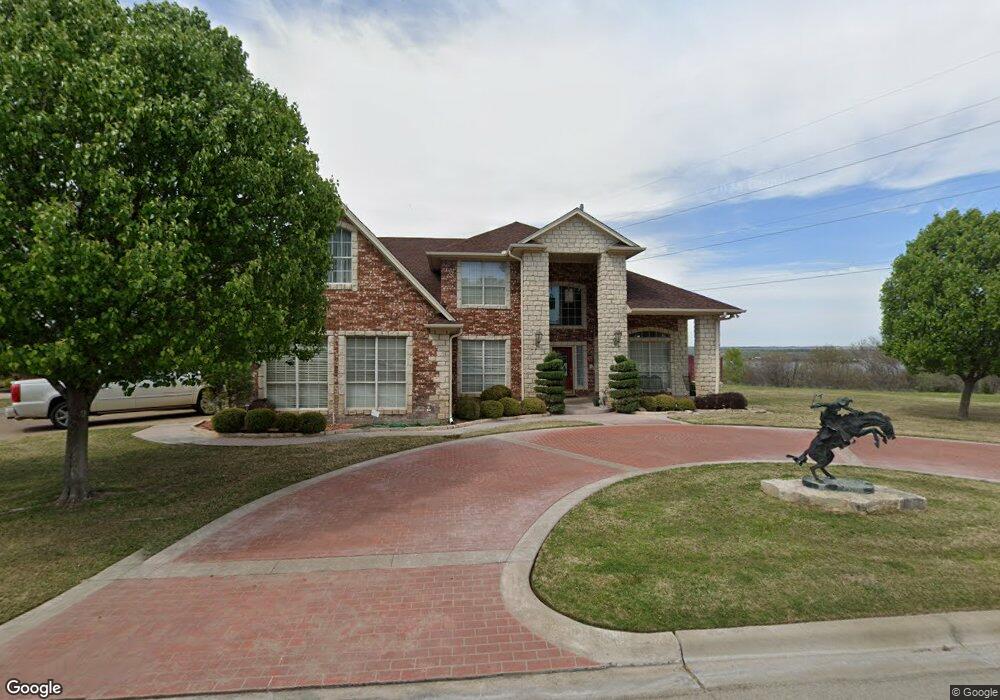
3601 Cliff View Loop Weatherford, TX 76087
Estimated Value: $629,877 - $789,000
--
Bed
--
Bath
3,485
Sq Ft
$197/Sq Ft
Est. Value
About This Home
This home is located at 3601 Cliff View Loop, Weatherford, TX 76087 and is currently estimated at $688,219, approximately $197 per square foot. 3601 Cliff View Loop is a home located in Parker County with nearby schools including Martin Elementary School, Tison Middle School, and Weatherford High School.
Ownership History
Date
Name
Owned For
Owner Type
Purchase Details
Closed on
Nov 21, 2020
Sold by
Brunson Welton Kirkland
Bought by
Brunson Real Estate Holdings Lp
Current Estimated Value
Purchase Details
Closed on
Nov 20, 2020
Sold by
Brunson Welton Kirkland
Bought by
Craine Teresa Elizabeth
Purchase Details
Closed on
Nov 19, 2020
Sold by
Brunson Barbara Ann and Estate Of Barbara Ann Brunson
Bought by
Brunson Welton Kirkland
Purchase Details
Closed on
Aug 15, 2000
Sold by
Nickelson Ranzell
Bought by
Brunson Kirk and Brunson Barbara
Purchase Details
Closed on
Nov 30, 1999
Sold by
Mcbee Ronald D
Bought by
Brunson Kirk and Brunson Barbara
Purchase Details
Closed on
Jun 27, 1997
Bought by
Brunson Kirk and Brunson Barbara
Purchase Details
Closed on
Feb 25, 1997
Bought by
Brunson Kirk and Brunson Barbara
Purchase Details
Closed on
Jan 1, 1901
Bought by
Brunson Kirk and Brunson Barbara
Create a Home Valuation Report for This Property
The Home Valuation Report is an in-depth analysis detailing your home's value as well as a comparison with similar homes in the area
Home Values in the Area
Average Home Value in this Area
Purchase History
| Date | Buyer | Sale Price | Title Company |
|---|---|---|---|
| Brunson Real Estate Holdings Lp | -- | None Listed On Document | |
| Craine Teresa Elizabeth | -- | None Listed On Document | |
| Brunson Welton Kirkland | -- | None Listed On Document | |
| Brunson Welton Kirkland | -- | None Available | |
| Brunson Kirk | -- | -- | |
| Brunson Kirk | -- | -- | |
| Brunson Kirk | -- | -- | |
| Brunson Kirk | -- | -- | |
| Brunson Kirk | -- | -- |
Source: Public Records
Tax History Compared to Growth
Tax History
| Year | Tax Paid | Tax Assessment Tax Assessment Total Assessment is a certain percentage of the fair market value that is determined by local assessors to be the total taxable value of land and additions on the property. | Land | Improvement |
|---|---|---|---|---|
| 2025 | $4,316 | $640,175 | -- | -- |
| 2024 | $4,316 | $581,977 | -- | -- |
| 2023 | $4,316 | $529,070 | $0 | $0 |
| 2022 | $10,669 | $480,980 | $30,000 | $450,980 |
| 2021 | $11,551 | $480,980 | $30,000 | $450,980 |
| 2020 | $10,783 | $446,270 | $30,000 | $416,270 |
| 2019 | $10,876 | $446,270 | $30,000 | $416,270 |
| 2018 | $9,931 | $387,180 | $30,000 | $357,180 |
| 2017 | $9,723 | $387,180 | $30,000 | $357,180 |
| 2016 | $8,840 | $335,950 | $30,000 | $305,950 |
| 2015 | $6,473 | $335,950 | $30,000 | $305,950 |
| 2014 | $6,599 | $321,800 | $30,000 | $291,800 |
Source: Public Records
Map
Nearby Homes
- 3609 Marina Link
- 318 W Lake Dr
- 3616 Overlook Manor
- 3409 Foot Hills Dr
- 3509 Lakeshore Dr
- 3610 Lakeshore Dr
- 3806 Lakeshore Dr
- 3210 Bluebonnet Cir
- 1317 Thistle Hill Trail
- 1029 Brown Valley Trail
- 408 Canyon Trail Rd
- 1025 Gannon Valley Trail
- 712 W Lake Dr
- 1028 Gannon Valley Trail
- 3503 Red Bud Dr
- 221 Valley Ranch Rd
- 3708 Oak Park Dr Unit A
- 106 Winfield St
- 1733 E Lake Dr
- 1106 Reata Dr
- 3537 Cliff View Loop
- 3605 Cliff View Loop
- 3602 Cliff View Loop
- 3533 Cliff View Loop
- 3612 Foot Hills Dr
- 3534 Cliff View Loop
- 218 Ridge Hollow Trail
- 3529 Cliff View Loop
- 3608 Foot Hills Dr
- 3606 Cliff View Loop
- 221 Ridge Hollow Trail
- 3616 Foot Hills Dr
- 3526 Cliff View Loop
- 3604 Foot Hills Dr
- 216 Evergreen Trail
- 217 Ridge Hollow Trail
- 3613 Foot Hills Dr
- 3610 Cliff View Loop
- 3525 Cliff View Loop