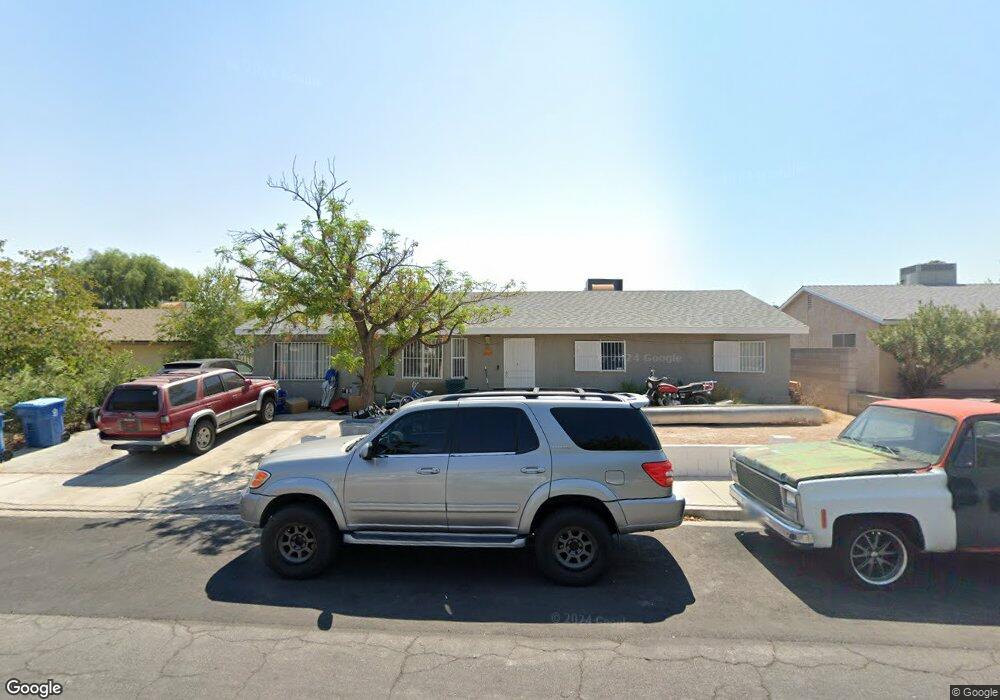
3601 Hudson Bay Ave Las Vegas, NV 89110
East Las Vegas NeighborhoodEstimated Value: $320,000 - $394,000
3
Beds
2
Baths
1,740
Sq Ft
$208/Sq Ft
Est. Value
About This Home
This home is located at 3601 Hudson Bay Ave, Las Vegas, NV 89110 and is currently estimated at $362,181, approximately $208 per square foot. 3601 Hudson Bay Ave is a home located in Clark County with nearby schools including Oran K Gragson Elementary School, Roy West Martin Middle School, and Desert Pines High School.
Ownership History
Date
Name
Owned For
Owner Type
Purchase Details
Closed on
May 25, 2007
Sold by
Bautista Ramon
Bought by
Retano Julia
Current Estimated Value
Purchase Details
Closed on
Apr 6, 2002
Sold by
Ibarra Olympia and Bautista Abad
Bought by
Bautista Abad and Retano Julia
Home Financials for this Owner
Home Financials are based on the most recent Mortgage that was taken out on this home.
Original Mortgage
$93,750
Outstanding Balance
$38,697
Interest Rate
6.75%
Mortgage Type
Negative Amortization
Estimated Equity
$323,484
Purchase Details
Closed on
Oct 21, 1996
Sold by
Louie Ben W and Louie Way Bring
Bought by
Bautista Abad and Ibarra Olimpia
Home Financials for this Owner
Home Financials are based on the most recent Mortgage that was taken out on this home.
Original Mortgage
$71,472
Interest Rate
8.14%
Mortgage Type
FHA
Purchase Details
Closed on
Jan 19, 1995
Sold by
Adams Eugene D and Adams Lenore E
Bought by
Louie Ben and Louie Way Bring
Create a Home Valuation Report for This Property
The Home Valuation Report is an in-depth analysis detailing your home's value as well as a comparison with similar homes in the area
Home Values in the Area
Average Home Value in this Area
Purchase History
| Date | Buyer | Sale Price | Title Company |
|---|---|---|---|
| Retano Julia | -- | Fidelity National Title | |
| Retano Julia | -- | Fidelity National Title | |
| Bautista Abad | $125,000 | Land Title | |
| Bautista Abad | $72,000 | Nevada Title Company | |
| Louie Ben | -- | -- |
Source: Public Records
Mortgage History
| Date | Status | Borrower | Loan Amount |
|---|---|---|---|
| Open | Bautista Abad | $93,750 | |
| Closed | Bautista Abad | $71,472 |
Source: Public Records
Tax History Compared to Growth
Tax History
| Year | Tax Paid | Tax Assessment Tax Assessment Total Assessment is a certain percentage of the fair market value that is determined by local assessors to be the total taxable value of land and additions on the property. | Land | Improvement |
|---|---|---|---|---|
| 2025 | $1,325 | $51,627 | $25,550 | $26,077 |
| 2024 | $1,061 | $51,627 | $25,550 | $26,077 |
| 2023 | $958 | $54,640 | $28,700 | $25,940 |
| 2022 | $983 | $48,701 | $24,500 | $24,201 |
| 2021 | $2,190 | $45,462 | $22,050 | $23,412 |
| 2020 | $842 | $44,696 | $21,000 | $23,696 |
| 2019 | $790 | $40,515 | $16,800 | $23,715 |
| 2018 | $753 | $38,091 | $15,050 | $23,041 |
| 2017 | $1,234 | $37,653 | $14,000 | $23,653 |
| 2016 | $958 | $31,437 | $7,000 | $24,437 |
| 2015 | $704 | $27,625 | $5,600 | $22,025 |
| 2014 | $683 | $20,694 | $4,200 | $16,494 |
Source: Public Records
Map
Nearby Homes
- 3700 Stewart Ave Unit 183
- 432 Anchor St
- 3908 Montebello Ave
- 3933 Lighthouse Ave
- 3901 Stewart Ave Unit 40
- 4028 Lighthouse Ave
- 1405 N Sandhill Rd Unit 2
- 3982 Saguaro Ln
- 348 Century Dr
- 4100 Montebello Ave
- 653 Lineshack Ln
- 4108 Montebello Ave
- 4117 Lighthouse Ave
- 3620 Park Oliver Dr
- 3933 Harris Ave
- 833 Hedge Way Unit 2
- 833 Hedge Way Unit 6
- 848 Hedge Way Unit 5
- 2915 Cedar Ave Unit 11C
- 2915 Cedar Ave Unit 12C
- 3605 Hudson Bay Ave
- 3517 Hudson Bay Ave
- 3600 Lighthouse Ave
- 3516 Lighthouse Ave
- 3604 Lighthouse Ave
- 3609 Hudson Bay Ave
- 3600 Hudson Bay Ave
- 3513 Hudson Bay Ave
- 3604 Hudson Bay Ave
- 3516 Hudson Bay Ave
- 3608 Lighthouse Ave
- 3512 Lighthouse Ave
- 3608 Hudson Bay Ave
- 3512 Hudson Bay Ave
- 3613 Hudson Bay Ave
- 3509 Hudson Bay Ave
- 3612 Lighthouse Ave
- 3612 Lighthouse Ave
- 3612 Lighthouse Ave
- 3601 Diamond Head Dr