Estimated Value: $402,000 - $468,000
4
Beds
3
Baths
2,188
Sq Ft
$195/Sq Ft
Est. Value
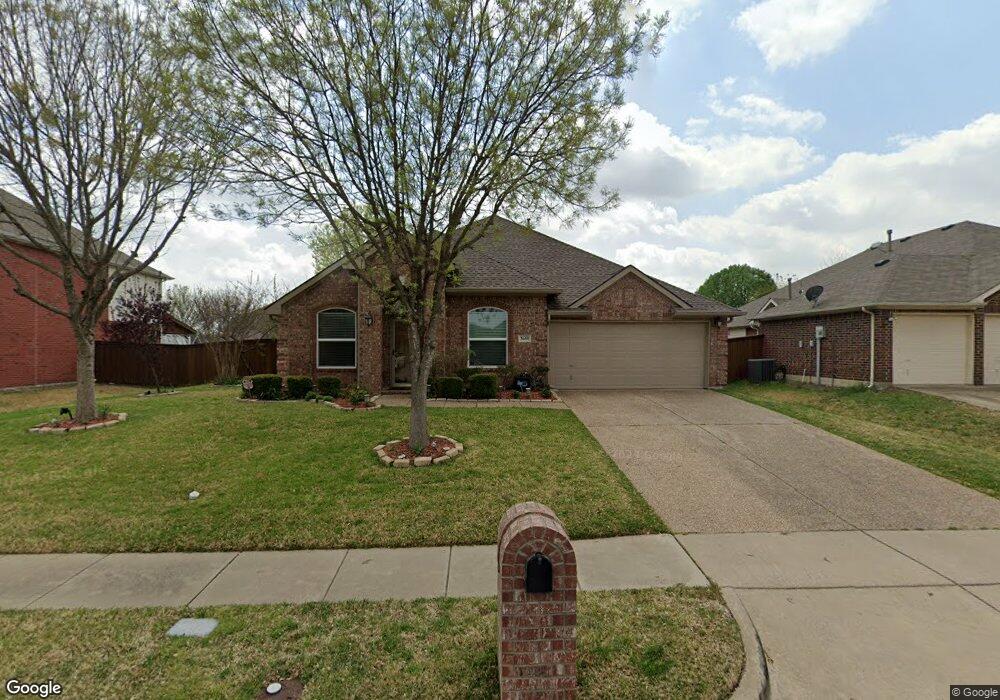
About This Home
This home is located at 3601 Spirea Dr, Wylie, TX 75098 and is currently estimated at $426,805, approximately $195 per square foot. 3601 Spirea Dr is a home located in Collin County with nearby schools including R V Groves Elementary School, Dr. Al Draper Intermediate Middle School, and Raymond B Cooper J High School.
Ownership History
Date
Name
Owned For
Owner Type
Purchase Details
Closed on
Jan 17, 2022
Sold by
Peaches and Toni
Bought by
Lp & Tp Family Revocable Trust
Current Estimated Value
Purchase Details
Closed on
Jan 11, 2013
Sold by
Peaches Lacy
Bought by
Peaches Lacy and Peaches Toni
Home Financials for this Owner
Home Financials are based on the most recent Mortgage that was taken out on this home.
Original Mortgage
$153,000
Interest Rate
3.34%
Mortgage Type
New Conventional
Purchase Details
Closed on
Sep 25, 2002
Sold by
Mercedes Homes Of Texas Ltd
Bought by
Peaches Lacy
Home Financials for this Owner
Home Financials are based on the most recent Mortgage that was taken out on this home.
Original Mortgage
$144,950
Interest Rate
6.21%
Create a Home Valuation Report for This Property
The Home Valuation Report is an in-depth analysis detailing your home's value as well as a comparison with similar homes in the area
Home Values in the Area
Average Home Value in this Area
Purchase History
| Date | Buyer | Sale Price | Title Company |
|---|---|---|---|
| Lp & Tp Family Revocable Trust | -- | None Listed On Document | |
| Peaches Lacy | -- | Chicago Title Company | |
| Peaches Lacy | -- | -- |
Source: Public Records
Mortgage History
| Date | Status | Borrower | Loan Amount |
|---|---|---|---|
| Previous Owner | Peaches Lacy | $153,000 | |
| Previous Owner | Peaches Lacy | $144,950 | |
| Closed | Peaches Lacy | $36,240 |
Source: Public Records
Tax History Compared to Growth
Tax History
| Year | Tax Paid | Tax Assessment Tax Assessment Total Assessment is a certain percentage of the fair market value that is determined by local assessors to be the total taxable value of land and additions on the property. | Land | Improvement |
|---|---|---|---|---|
| 2025 | $5,916 | $402,250 | $135,000 | $310,086 |
| 2024 | $5,916 | $365,682 | $120,000 | $286,865 |
| 2023 | $5,916 | $332,438 | $120,000 | $298,089 |
| 2022 | $6,630 | $302,216 | $95,000 | $266,816 |
| 2021 | $6,464 | $274,742 | $80,000 | $194,742 |
| 2020 | $6,730 | $271,039 | $80,000 | $191,039 |
| 2019 | $6,854 | $260,813 | $70,000 | $190,813 |
| 2018 | $6,848 | $254,279 | $70,000 | $188,310 |
| 2017 | $6,225 | $246,084 | $70,000 | $176,084 |
| 2016 | $5,839 | $225,702 | $50,000 | $175,702 |
| 2015 | $4,925 | $196,588 | $45,000 | $151,588 |
Source: Public Records
Map
Nearby Homes
- 413 Royal Oak Dr
- 517 Royal Oak Dr
- 3119 Connor Ln
- 802 Appalachian Dr
- 3600 Nandina Dr
- 3111 Candlebrook Dr
- 3105 Admiral Dr
- 620 Fall Wheat Dr
- 3014 Eastwood Dr
- 404 Crepe Myrtle Ln
- 3017 Eagle Mountain Dr
- 3103 Creekwood Dr
- 310 Admiral Dr
- 3003 Candlebrook Dr
- 3006 Springwell Pkwy
- 307 Wooded Creek Ave
- 2912 Katie Cir
- Iris Plan at Wooded Creek
- Beckett II Plan at Wooded Creek
- Annabelle III Plan at Wooded Creek
- 3507 Spirea Dr
- 3603 Spirea Dr
- 3602 Hibiscus Dr
- 3602 Hibiscus Dr
- 3600 Hibiscus Dr
- 3604 Hibiscus Dr
- 3505 Spirea Dr
- 3605 Spirea Dr
- 3506 Spirea Dr
- 3506 Hibiscus Dr
- 3508 Spirea Dr
- 3504 Spirea Dr
- 3600 Spirea Dr
- 3606 Hibiscus Dr
- 3503 Spirea Dr
- 3504 Hibiscus Dr
- 3607 Spirea Dr
- 3502 Spirea Dr
- 3602 Spirea Dr
- 3605 Hibiscus Dr