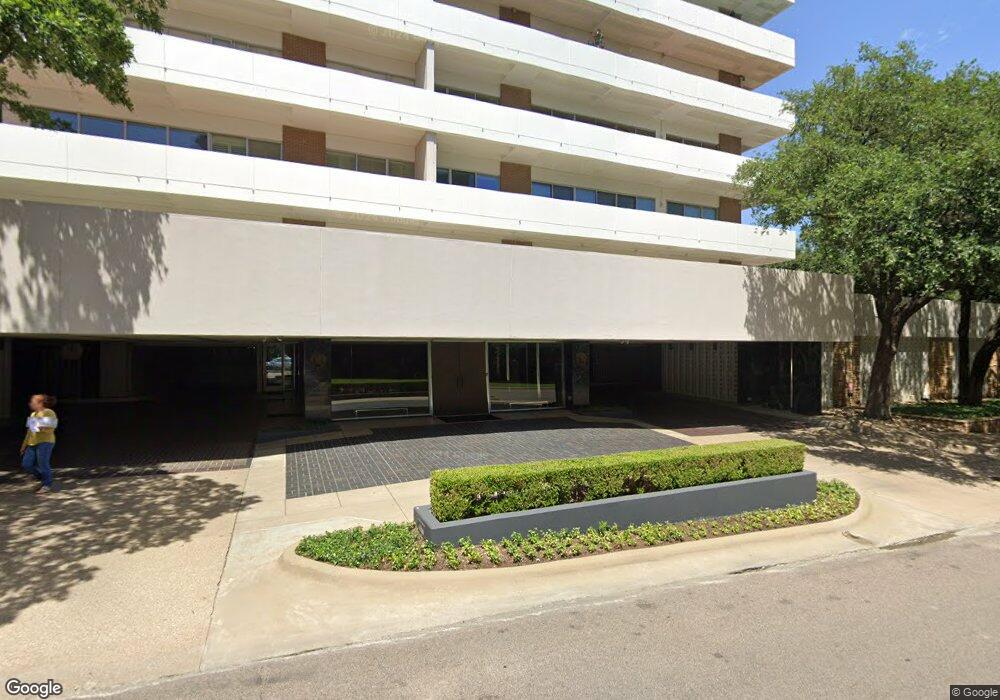
3601 Turtle Creek Blvd Unit T6 Dallas, TX 75219
Turtle Creek NeighborhoodEstimated Value: $723,000 - $898,000
2
Beds
2
Baths
1,680
Sq Ft
$479/Sq Ft
Est. Value
About This Home
This home is located at 3601 Turtle Creek Blvd Unit T6, Dallas, TX 75219 and is currently estimated at $804,543, approximately $478 per square foot. 3601 Turtle Creek Blvd Unit T6 is a home located in Dallas County with nearby schools including Ben Milam Elementary School, Alex W. Spence Talented/Gifted Academy, and North Dallas High School.
Ownership History
Date
Name
Owned For
Owner Type
Purchase Details
Closed on
Feb 7, 2025
Sold by
Russell Phillissa D
Bought by
Ismond Thompson Trust and Ismond
Current Estimated Value
Purchase Details
Closed on
Aug 28, 2001
Sold by
Gscheidle Paul J
Bought by
Rossi Henry J
Home Financials for this Owner
Home Financials are based on the most recent Mortgage that was taken out on this home.
Original Mortgage
$20,000
Interest Rate
6.98%
Mortgage Type
Seller Take Back
Purchase Details
Closed on
Nov 26, 1997
Sold by
Pearcy John K and Pearcy Constance Flowers
Bought by
Gscheidle Paul J
Home Financials for this Owner
Home Financials are based on the most recent Mortgage that was taken out on this home.
Original Mortgage
$150,000
Interest Rate
7.3%
Purchase Details
Closed on
Jan 12, 1994
Sold by
Auclair Donald C
Bought by
Pearcy John K
Create a Home Valuation Report for This Property
The Home Valuation Report is an in-depth analysis detailing your home's value as well as a comparison with similar homes in the area
Home Values in the Area
Average Home Value in this Area
Purchase History
| Date | Buyer | Sale Price | Title Company |
|---|---|---|---|
| Ismond Thompson Trust | -- | Capital Title | |
| Rossi Henry J | -- | -- | |
| Gscheidle Paul J | -- | -- | |
| Pearcy John K | -- | -- |
Source: Public Records
Mortgage History
| Date | Status | Borrower | Loan Amount |
|---|---|---|---|
| Previous Owner | Rossi Henry J | $20,000 | |
| Previous Owner | Gscheidle Paul J | $150,000 |
Source: Public Records
Tax History Compared to Growth
Tax History
| Year | Tax Paid | Tax Assessment Tax Assessment Total Assessment is a certain percentage of the fair market value that is determined by local assessors to be the total taxable value of land and additions on the property. | Land | Improvement |
|---|---|---|---|---|
| 2025 | $3,239 | $966,000 | $98,120 | $867,880 |
| 2024 | $3,239 | $873,600 | $98,120 | $775,480 |
| 2023 | $3,239 | $772,800 | $98,120 | $674,680 |
| 2022 | $19,323 | $772,800 | $98,120 | $674,680 |
| 2021 | $20,386 | $772,800 | $98,120 | $674,680 |
| 2020 | $20,965 | $772,800 | $98,120 | $674,680 |
| 2019 | $16,730 | $588,000 | $98,120 | $489,880 |
| 2018 | $13,731 | $504,950 | $58,030 | $446,920 |
| 2017 | $9,372 | $344,650 | $58,030 | $286,620 |
| 2016 | $6,757 | $248,470 | $38,690 | $209,780 |
| 2015 | $3,635 | $248,470 | $38,690 | $209,780 |
| 2014 | $3,635 | $248,470 | $38,690 | $209,780 |
Source: Public Records
Map
Nearby Homes
- 3601 Turtle Creek Blvd Unit 802
- 3601 Turtle Creek Blvd Unit T3
- 3601 Turtle Creek Blvd Unit 1006
- 3621 Turtle Creek Blvd Unit 9K
- 3525 Turtle Creek Blvd Unit 22A
- 3525 Turtle Creek Blvd Unit 3C
- 3525 Turtle Creek Blvd Unit 6D
- 3525 Turtle Creek Blvd Unit 4E
- 3525 Turtle Creek Blvd Unit 3D
- 3701 Turtle Creek Blvd Unit 3
- 3701 Turtle Creek Blvd Unit 7J
- 3701 Turtle Creek Blvd Unit 8H
- 3701 Turtle Creek Blvd Unit 4J
- 3701 Turtle Creek Blvd Unit 5
- 3505 Turtle Creek Blvd Unit 2A
- 3505 Turtle Creek Blvd Unit 2F
- 3505 Turtle Creek Blvd Unit 4C
- 3505 Turtle Creek Blvd Unit 12F
- 3505 Turtle Creek Blvd Unit 5A
- 3505 Turtle Creek Blvd Unit 18C
- 3601 Turtle Creek Blvd Unit 504
- 3601 Turtle Creek Blvd Unit 905
- 3601 Turtle Creek Blvd Unit 806
- 3601 Turtle Creek Blvd Unit 302
- 3601 Turtle Creek Blvd Unit 206
- 3601 Turtle Creek Blvd Unit 201
- 3601 Turtle Creek Blvd Unit 203
- 3601 Turtle Creek Blvd Unit T4
- 3601 Turtle Creek Blvd Unit 601
- 3601 Turtle Creek Blvd Unit 502
- 3601 Turtle Creek Blvd Unit 801
- 3601 Turtle Creek Blvd Unit 501
- 3601 Turtle Creek Blvd Unit 701
- 3601 Turtle Creek Blvd Unit 402
- 3601 Turtle Creek Blvd Unit 401
- 3601 Turtle Creek Blvd Unit 901
- 3601 Turtle Creek Blvd Unit 205
- 3601 Turtle Creek Blvd Unit 704
- 3601 Turtle Creek Blvd Unit 503
- 3601 Turtle Creek Blvd Unit 605