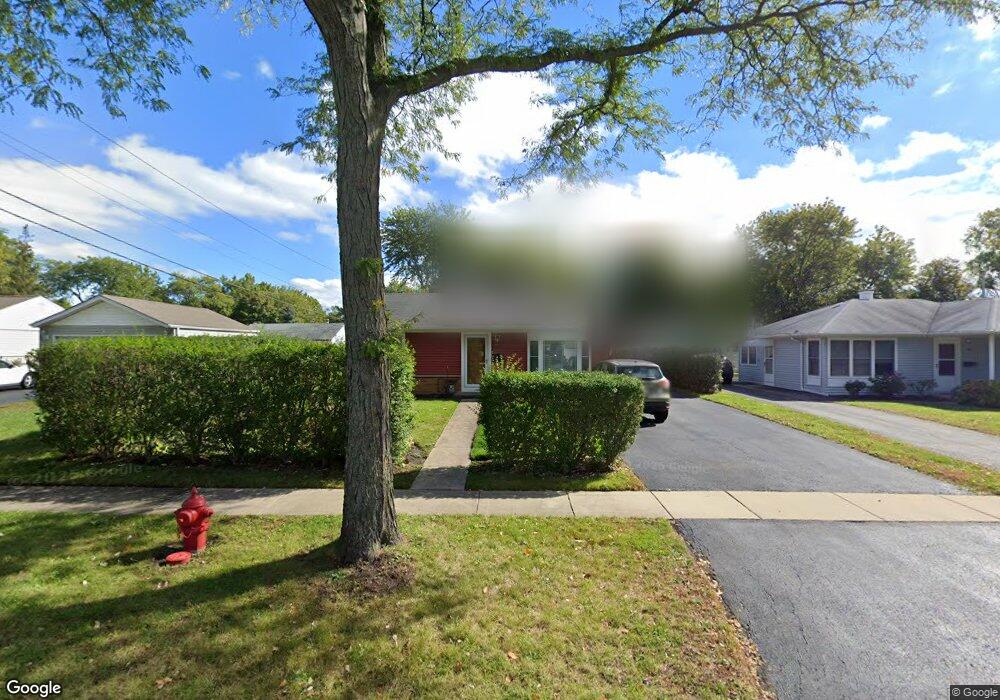
3602 Bobwhite Ln Rolling Meadows, IL 60008
Estimated Value: $294,125 - $337,000
2
Beds
1
Bath
861
Sq Ft
$367/Sq Ft
Est. Value
About This Home
This home is located at 3602 Bobwhite Ln, Rolling Meadows, IL 60008 and is currently estimated at $316,281, approximately $367 per square foot. 3602 Bobwhite Ln is a home located in Cook County with nearby schools including Willow Bend Elementary School, Carl Sandburg Junior High School, and Rolling Meadows High School.
Ownership History
Date
Name
Owned For
Owner Type
Purchase Details
Closed on
Jun 28, 2001
Sold by
Valovic Lynn M
Bought by
Larson William F and Larson Heather C
Current Estimated Value
Home Financials for this Owner
Home Financials are based on the most recent Mortgage that was taken out on this home.
Original Mortgage
$157,731
Outstanding Balance
$58,508
Interest Rate
7.27%
Mortgage Type
FHA
Estimated Equity
$257,773
Purchase Details
Closed on
Nov 7, 2000
Sold by
Niewiadomski Lynn M and Valovic Lynn M
Bought by
Valovic Lynn M
Home Financials for this Owner
Home Financials are based on the most recent Mortgage that was taken out on this home.
Original Mortgage
$115,000
Interest Rate
7.87%
Purchase Details
Closed on
Jul 7, 1999
Sold by
Niewiadomski Stephen T
Bought by
Niewiadomski Lynn M
Create a Home Valuation Report for This Property
The Home Valuation Report is an in-depth analysis detailing your home's value as well as a comparison with similar homes in the area
Home Values in the Area
Average Home Value in this Area
Purchase History
| Date | Buyer | Sale Price | Title Company |
|---|---|---|---|
| Larson William F | $160,000 | -- | |
| Valovic Lynn M | -- | -- | |
| Niewiadomski Lynn M | -- | Chicago Title Insurance Co |
Source: Public Records
Mortgage History
| Date | Status | Borrower | Loan Amount |
|---|---|---|---|
| Open | Larson William F | $157,731 | |
| Previous Owner | Valovic Lynn M | $115,000 |
Source: Public Records
Tax History
| Year | Tax Paid | Tax Assessment Tax Assessment Total Assessment is a certain percentage of the fair market value that is determined by local assessors to be the total taxable value of land and additions on the property. | Land | Improvement |
|---|---|---|---|---|
| 2025 | $5,420 | $25,000 | $5,070 | $19,930 |
| 2024 | $5,420 | $21,000 | $4,290 | $16,710 |
| 2023 | $5,160 | $21,000 | $4,290 | $16,710 |
| 2022 | $5,160 | $21,000 | $4,290 | $16,710 |
| 2021 | $4,163 | $15,900 | $2,535 | $13,365 |
| 2020 | $4,138 | $15,900 | $2,535 | $13,365 |
| 2019 | $4,171 | $17,766 | $2,535 | $15,231 |
| 2018 | $4,216 | $16,453 | $2,340 | $14,113 |
| 2017 | $4,150 | $16,453 | $2,340 | $14,113 |
| 2016 | $4,125 | $16,453 | $2,340 | $14,113 |
| 2015 | $4,033 | $15,433 | $2,145 | $13,288 |
| 2014 | $3,954 | $15,433 | $2,145 | $13,288 |
| 2013 | $3,841 | $15,433 | $2,145 | $13,288 |
Source: Public Records
Map
Nearby Homes
- 399 Knollwood Ct
- 3200 Thrush Ln
- 3345 Kirchoff Rd Unit 5C
- 3265 Kirchoff Rd Unit 116
- 3135 Town Square Dr Unit 401
- 3100 Town Square Dr Unit 308
- 3100 Town Square Dr Unit 204
- 3306 Trillium Cir Unit 3001
- 3209 Trillium Cir
- 3 Holyoke on Auburn
- 3710 Meadow Dr
- 2709 Lily Ln
- 3712 Jay Ln
- 2705 Park St
- 3605 Oriole Ln
- 2600 Brookwood Way Dr Unit 316
- 2600 Brookwood Way Dr Unit 305
- 2650 Brookwood Way Dr Unit 313
- 2650 Brookwood Way Dr Unit 108
- 86 Brookdale Ln
- 3604 Bobwhite Ln
- 3600 Bobwhite Ln
- 3509 Thrush Ln
- 3606 Bobwhite Ln
- 3504 Piper Ct
- 3507 Thrush Ln
- 3700 Bobwhite Ln
- 3607 Bobwhite Ln
- 3609 Bobwhite Ln
- 3505 Thrush Ln
- 3611 Bobwhite Ln
- 3502 Piper Ct
- 3603 Bobwhite Ln
- 3702 Bobwhite Ln
- 3503 Thrush Ln
- 3701 Bobwhite Ln
- 3505 Piper Ct
- 3510 Thrush Ln
- 3508 Thrush Ln
- 3704 Bobwhite Ln
Your Personal Tour Guide
Ask me questions while you tour the home.