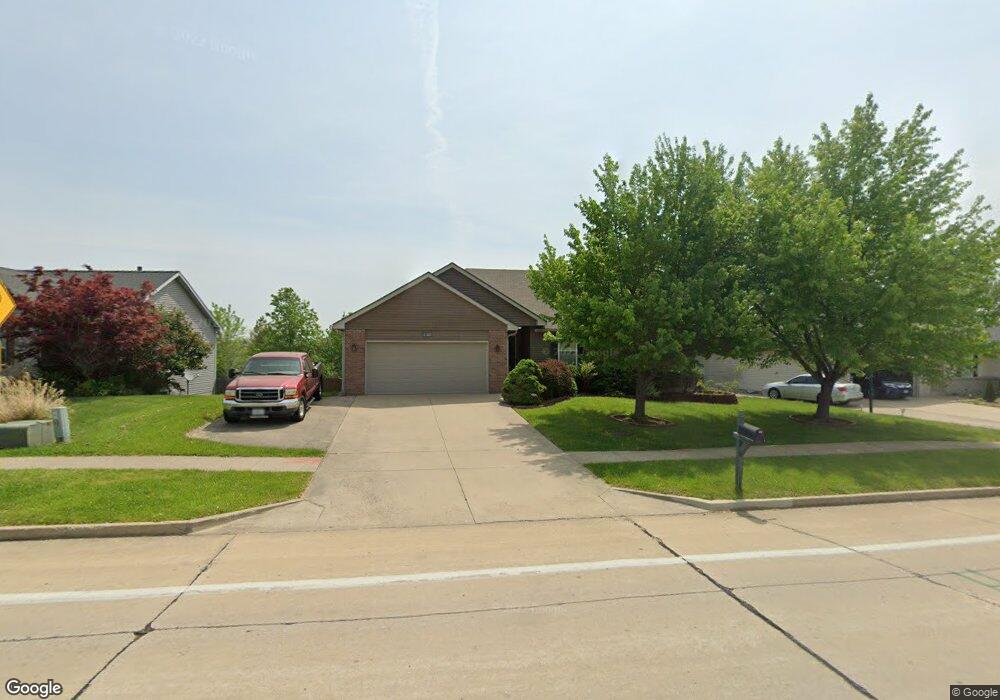
3602 Derby Ridge Dr Columbia, MO 65202
Estimated Value: $323,000 - $335,000
4
Beds
3
Baths
2,637
Sq Ft
$125/Sq Ft
Est. Value
About This Home
This home is located at 3602 Derby Ridge Dr, Columbia, MO 65202 and is currently estimated at $329,340, approximately $124 per square foot. 3602 Derby Ridge Dr is a home located in Boone County with nearby schools including Derby Ridge Elementary School, John B. Lange Middle School, and Muriel W. Battle High School.
Ownership History
Date
Name
Owned For
Owner Type
Purchase Details
Closed on
Dec 23, 2020
Sold by
Sengalvarayan Arunkumar
Bought by
Sengalvarayan Arunkumar and Revoca Arunkumar Sengalvarayan
Current Estimated Value
Purchase Details
Closed on
Feb 10, 2020
Sold by
Kuppan Menaka
Bought by
Sengalvarayan Arunkumar
Home Financials for this Owner
Home Financials are based on the most recent Mortgage that was taken out on this home.
Original Mortgage
$77,000
Interest Rate
3.1%
Mortgage Type
New Conventional
Purchase Details
Closed on
Feb 17, 2010
Sold by
Federal National Mortgage Association
Bought by
Sengalvarayan Arunkumar and Kuppan Menaka
Home Financials for this Owner
Home Financials are based on the most recent Mortgage that was taken out on this home.
Original Mortgage
$131,200
Interest Rate
5.11%
Mortgage Type
New Conventional
Purchase Details
Closed on
Sep 17, 2009
Sold by
Telken Mark J and Telken Julie A
Bought by
Federal National Mortgage Association
Create a Home Valuation Report for This Property
The Home Valuation Report is an in-depth analysis detailing your home's value as well as a comparison with similar homes in the area
Purchase History
| Date | Buyer | Sale Price | Title Company |
|---|---|---|---|
| Sengalvarayan Arunkumar | -- | None Available | |
| Sengalvarayan Arunkumar | -- | None Available | |
| Sengalvarayan Arunkumar | -- | Mokan Title Services Llc | |
| Federal National Mortgage Association | $134,744 | Mokan Title Services Llc |
Source: Public Records
Mortgage History
| Date | Status | Borrower | Loan Amount |
|---|---|---|---|
| Previous Owner | Sengalvarayan Arunkumar | $77,000 | |
| Previous Owner | Sengalvarayan Arunkumar | $131,200 |
Source: Public Records
Tax History
| Year | Tax Paid | Tax Assessment Tax Assessment Total Assessment is a certain percentage of the fair market value that is determined by local assessors to be the total taxable value of land and additions on the property. | Land | Improvement |
|---|---|---|---|---|
| 2025 | $2,782 | $42,484 | $5,035 | $37,449 |
| 2024 | $2,503 | $37,107 | $5,035 | $32,072 |
| 2023 | $2,483 | $37,107 | $5,035 | $32,072 |
| 2022 | $2,385 | $35,682 | $5,035 | $30,647 |
| 2021 | $2,389 | $35,682 | $5,035 | $30,647 |
| 2020 | $2,354 | $33,037 | $5,035 | $28,002 |
| 2019 | $2,354 | $33,037 | $5,035 | $28,002 |
| 2018 | $2,195 | $0 | $0 | $0 |
| 2017 | $2,169 | $30,590 | $5,035 | $25,555 |
| 2016 | $2,165 | $30,590 | $5,035 | $25,555 |
| 2015 | $1,988 | $30,590 | $5,035 | $25,555 |
| 2014 | $1,995 | $30,590 | $5,035 | $25,555 |
Source: Public Records
Map
Nearby Homes
- 1302 Look Out Ct
- 1504 Furlong Dr
- 3800 Saddlebrook Place Unit 403
- 1605 Skylane Dr
- 4109 Citation Dr
- 0 Rangeline St
- 1815 Blue Ridge Rd
- 510 Cheetah Dr
- 3811 Panther Dr
- 2801 Parker St
- 8065 N Glen Meadow Dr
- 4604 Derby Ridge Dr
- 4702 Derby Ridge Dr
- 3901 Bragg Ct
- 3905 Bragg Ct
- 2501 Nest Ct
- 3921 Bragg Ct
- 6029 Kestrel Loop St
- 5813 Kestrel Loop St
- 6017 Kestrel Loop St
- 3604 Derby Ridge Dr
- 3600 Derby Ridge Dr
- 3603 Triple Crown Dr
- 3601 Triple Crown Dr
- 3702 Derby Ridge Dr
- 1308 Look Out Ct
- 1307 War Admiral Dr
- 3701 Triple Crown Dr
- 1308 War Admiral Dr
- 1310 War Admiral Dr
- 3704 Derby Ridge Dr
- 1306 Look Out Ct
- 3703 Triple Crown Dr
- 1309 Look Out Ct
- 1312 War Admiral Dr
- 1306 War Admiral Dr
- 3602 Triple Crown Dr
- 3600 Triple Crown Dr
- 3700 Triple Crown Dr
- 1307 Look Out Ct
Your Personal Tour Guide
Ask me questions while you tour the home.