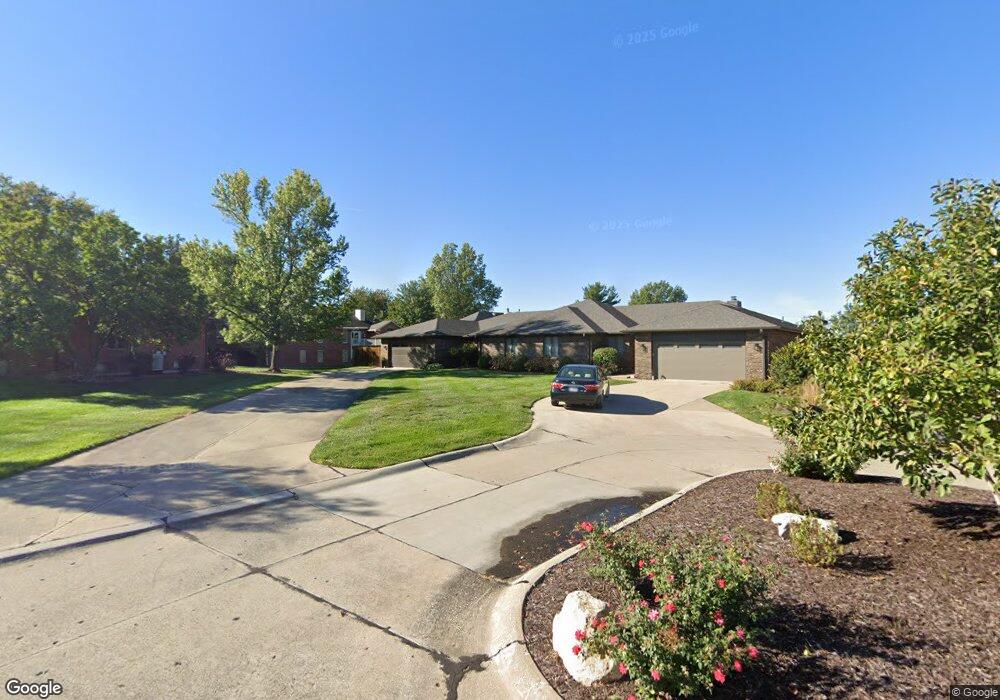
3603 Augusta Dr Unit A Columbia, MO 65203
Estimated Value: $343,454 - $406,000
3
Beds
2
Baths
2,004
Sq Ft
$187/Sq Ft
Est. Value
About This Home
This home is located at 3603 Augusta Dr Unit A, Columbia, MO 65203 and is currently estimated at $374,727, approximately $186 per square foot. 3603 Augusta Dr Unit A is a home located in Boone County with nearby schools including Russell Boulevard Elementary School, Ann Hawkins Gentry Middle School, and Rock Bridge High School.
Ownership History
Date
Name
Owned For
Owner Type
Purchase Details
Closed on
Oct 19, 2020
Sold by
Halberg Evan E
Bought by
Netemeyer Melinda
Current Estimated Value
Home Financials for this Owner
Home Financials are based on the most recent Mortgage that was taken out on this home.
Original Mortgage
$261,600
Outstanding Balance
$232,679
Interest Rate
2.9%
Mortgage Type
New Conventional
Estimated Equity
$142,048
Purchase Details
Closed on
May 16, 2008
Sold by
Rtm Properties Llc
Bought by
Halberg Evan E
Home Financials for this Owner
Home Financials are based on the most recent Mortgage that was taken out on this home.
Original Mortgage
$215,000
Interest Rate
5.89%
Mortgage Type
Purchase Money Mortgage
Purchase Details
Closed on
Mar 21, 2008
Sold by
Mendenhall Thomas C
Bought by
Rtm Properties Llc
Home Financials for this Owner
Home Financials are based on the most recent Mortgage that was taken out on this home.
Original Mortgage
$215,000
Interest Rate
5.89%
Mortgage Type
Purchase Money Mortgage
Create a Home Valuation Report for This Property
The Home Valuation Report is an in-depth analysis detailing your home's value as well as a comparison with similar homes in the area
Purchase History
| Date | Buyer | Sale Price | Title Company |
|---|---|---|---|
| Netemeyer Melinda | -- | Boone Central Title Company | |
| Halberg Evan E | -- | Boone Central Title Company | |
| Rtm Properties Llc | -- | None Available |
Source: Public Records
Mortgage History
| Date | Status | Borrower | Loan Amount |
|---|---|---|---|
| Open | Netemeyer Melinda | $261,600 | |
| Previous Owner | Halberg Evan E | $215,000 |
Source: Public Records
Tax History
| Year | Tax Paid | Tax Assessment Tax Assessment Total Assessment is a certain percentage of the fair market value that is determined by local assessors to be the total taxable value of land and additions on the property. | Land | Improvement |
|---|---|---|---|---|
| 2025 | $3,096 | $47,272 | $10,830 | $36,442 |
| 2024 | $2,785 | $41,287 | $10,830 | $30,457 |
| 2023 | $2,762 | $41,287 | $10,830 | $30,457 |
| 2022 | $2,654 | $39,706 | $10,830 | $28,876 |
| 2021 | $2,659 | $39,706 | $10,830 | $28,876 |
| 2020 | $2,830 | $39,706 | $10,830 | $28,876 |
| 2019 | $2,830 | $39,706 | $10,830 | $28,876 |
| 2018 | $2,638 | $0 | $0 | $0 |
| 2017 | $2,602 | $36,765 | $10,830 | $25,935 |
| 2016 | $2,602 | $36,765 | $10,830 | $25,935 |
| 2015 | $2,389 | $36,765 | $10,830 | $25,935 |
| 2014 | $2,397 | $36,765 | $10,830 | $25,935 |
Source: Public Records
Map
Nearby Homes
- 3501 Augusta Dr Unit 9B
- 1104 Lacosta Ct
- 3711 Shadow Glen Ct
- 3113 Shoreside Dr
- 1317 Sedona Villas Dr
- 3404 Woodrail Terrace
- 3405 Woodrail Terrace
- 3808 Barrington Dr
- 3809 Wakefield Dr
- 3208 Lynnwood Dr
- 1004 Rollingwood Dr
- 4403 Glen Eagle Dr
- 3509 Danvers Dr
- 4301 Glen Eagle Dr
- 4304 Royal Aberdeen St
- 1317 Troon Dr
- 2615 Burrwood Dr
- 2403 Lynnwood Dr
- 902 Shakertown Way
- 500 Sudbury Dr
- 3601 Augusta Dr
- 1111 Torrey Pines Dr
- 3605 Augusta Dr
- 3513 Augusta Dr
- 1109 Torrey Pines Dr
- 1113 Torrey Pines Dr
- 3607 Augusta Dr Unit A
- 3515 Augusta Dr
- 1115 Torrey Pines Dr
- 1201 Torrey Pines Dr
- 3511 Augusta Dr Unit 11A
- 3602 Augusta Dr Unit 32B
- 3600 Augusta Dr
- 1112 Torrey Pines Dr
- 1107 Torrey Pines Dr
- 1118 Laquinta Dr
- 3509 Augusta Dr Unit 11B
- 1203 Torrey Pines Dr
- 3608 Augusta Dr
- 1110 Torrey Pines Dr
Your Personal Tour Guide
Ask me questions while you tour the home.