3604 Langland Ct Florence, SC 29505
Estimated Value: $184,000 - $205,000
3
Beds
2
Baths
1,128
Sq Ft
$174/Sq Ft
Est. Value
About This Home
This home is located at 3604 Langland Ct, Florence, SC 29505 and is currently estimated at $196,188, approximately $173 per square foot. 3604 Langland Ct is a home located in Florence County with nearby schools including Savannah Grove Elementary School, Southside Middle School, and South Florence High School.
Ownership History
Date
Name
Owned For
Owner Type
Purchase Details
Closed on
Jan 23, 2014
Sold by
Taylor Jacob A and Taylor Jennifer Lynn
Bought by
Taylor Jacob A
Current Estimated Value
Home Financials for this Owner
Home Financials are based on the most recent Mortgage that was taken out on this home.
Original Mortgage
$93,610
Outstanding Balance
$70,289
Interest Rate
4.25%
Mortgage Type
FHA
Estimated Equity
$125,899
Purchase Details
Closed on
Oct 28, 2005
Sold by
C & C Builders Of Columbia Inc
Bought by
Taylor Jennifer Lynn and Taylor Jacob A
Home Financials for this Owner
Home Financials are based on the most recent Mortgage that was taken out on this home.
Original Mortgage
$96,797
Interest Rate
5.76%
Mortgage Type
New Conventional
Purchase Details
Closed on
Jul 1, 2005
Sold by
South Florence Developers Llc
Bought by
C&C Builders Of Columbia Inc
Purchase Details
Closed on
Jan 14, 2005
Sold by
Point South Developers Llc
Bought by
South Florence Developers Llc
Create a Home Valuation Report for This Property
The Home Valuation Report is an in-depth analysis detailing your home's value as well as a comparison with similar homes in the area
Purchase History
| Date | Buyer | Sale Price | Title Company |
|---|---|---|---|
| Taylor Jacob A | -- | -- | |
| Taylor Jennifer Lynn | $96,797 | -- | |
| C&C Builders Of Columbia Inc | $210,000 | -- | |
| South Florence Developers Llc | $935,000 | -- |
Source: Public Records
Mortgage History
| Date | Status | Borrower | Loan Amount |
|---|---|---|---|
| Open | Taylor Jacob A | $93,610 | |
| Closed | Taylor Jennifer Lynn | $96,797 |
Source: Public Records
Tax History
| Year | Tax Paid | Tax Assessment Tax Assessment Total Assessment is a certain percentage of the fair market value that is determined by local assessors to be the total taxable value of land and additions on the property. | Land | Improvement |
|---|---|---|---|---|
| 2024 | $547 | $6,317 | $920 | $5,397 |
| 2023 | $493 | $4,631 | $920 | $3,711 |
| 2022 | $572 | $4,631 | $920 | $3,711 |
| 2021 | $606 | $4,630 | $0 | $0 |
| 2020 | $558 | $4,630 | $0 | $0 |
| 2019 | $521 | $4,631 | $920 | $3,711 |
| 2018 | $488 | $4,630 | $0 | $0 |
| 2017 | $462 | $4,630 | $0 | $0 |
| 2016 | $422 | $4,630 | $0 | $0 |
| 2015 | $2,220 | $6,950 | $0 | $0 |
| 2014 | $381 | $0 | $0 | $0 |
Source: Public Records
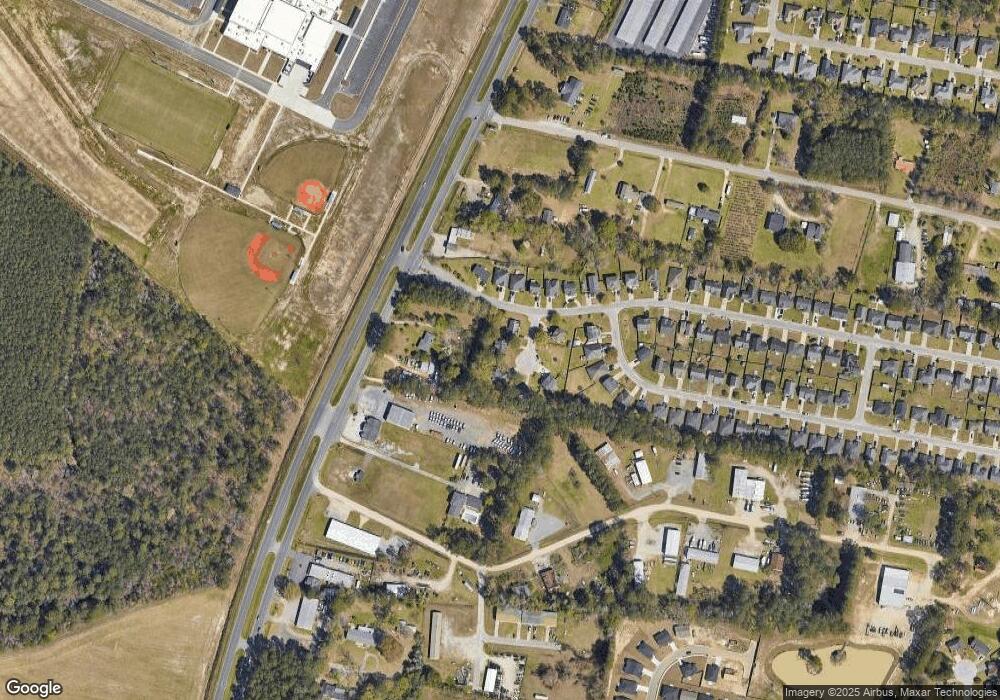
Map
Nearby Homes
- 3605 Langland Ct
- 3687 Saddle Ridge Dr
- 159 Jockey St
- 155 Jockey St
- 147 Jockey St
- 143 Jockey St
- 151 Jockey St
- 208 Saddle Ct
- 3440 Southbrook Cir
- 3828 Breckridge Cir
- 3116 Brookstone Dr
- 3908 Fox Run
- 3099 S Irby St
- 3141 Woodside Dr
- 272 Bluff View Ln
- 269 Bluff View Ln
- 273 Bluff View Ln
- 255 Bluff View Ln
- 251 Bluff View Ln
- 285 Bluff View Ln
- 3600 Langland Ct
- 3608 Langland Ct
- 3613 Langland Ct
- 3601 Langland Ct
- 3609 Langland Ct
- 3648 S Irby St
- 111 Rosemount Dr
- 109 Rosemount Dr
- 105 Rosemount Dr
- 121 Rosemount Dr
- 465 Rosemount Dr
- 461 Rosemount Dr
- 125 Rosemount Dr
- 469 Rosemount Dr
- 129 Rosemount Dr
- 457 Rosemount Dr
- 3650 S Irby St
- 3612 S Irby St
- 453 Rosemount Dr
- 200 Rosemount Dr
Your Personal Tour Guide
Ask me questions while you tour the home.