


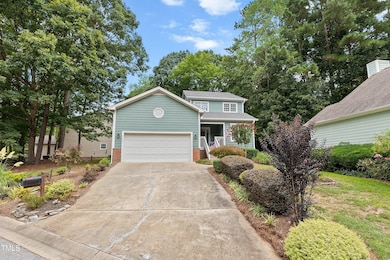
3604 Willowtree Ln Clayton, NC 27520
Estimated payment $2,138/month
Highlights
- Golf Course Community
- Main Floor Primary Bedroom
- Granite Countertops
- Traditional Architecture
- Sun or Florida Room
- Community Pool
About This Home
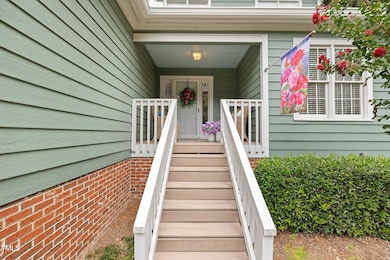
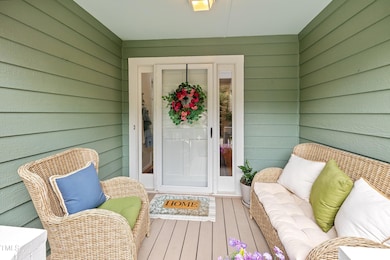
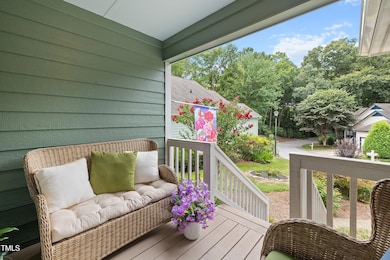
Welcome to this lovingly maintained home, nestled among mature trees in a swim and golf community, just minutes from downtown Clayton and only 20 minutes to downtown Raleigh. You can see the pride of ownership the moment you walk inside. This home offers low-maintenance living, with the HOA taking care of the roof, exterior painting, gutter cleaning, lawn care, and termite protection--all this and more with the benefits of low property taxes. Inside, you will find new carpet, and fresh neutral paint throughout. The main-level primary suite features a brand-new shower with tile and glass doors. A bright and spacious sunroom offers the perfect place to relax year-round, where you can enjoy your morning coffee or unwind at the end of the day. The chef's kitchen has an eat-in area plus plenty of cabinets, granite countertops and stainless steel refrigerator. Conveniently location near Neuse River Trl, Clemens Educational State Park, as well as Pine Hollow Golf course which surrounds the neighborhood. Enjoy nearby shopping, dining, and quick highway connections! 6 months of HOA dues paid at closing with accepted offer!! Sellers are motivated!
Home Details
Home Type
- Single Family
Est. Annual Taxes
- $2,183
Year Built
- Built in 1993
Lot Details
- 6,534 Sq Ft Lot
HOA Fees
- $323 Monthly HOA Fees
Parking
- 2 Car Attached Garage
Home Design
- Traditional Architecture
- Frame Construction
- Shingle Roof
Interior Spaces
- 1,931 Sq Ft Home
- 2-Story Property
- Entrance Foyer
- Family Room
- Breakfast Room
- Dining Room
- Sun or Florida Room
- Carpet
- Basement
- Crawl Space
- Laundry Room
Kitchen
- Eat-In Kitchen
- Granite Countertops
Bedrooms and Bathrooms
- 3 Bedrooms | 1 Primary Bedroom on Main
- Primary bathroom on main floor
Schools
- Cooper Academy Elementary School
- Riverwood Middle School
- Clayton High School
Utilities
- Forced Air Heating and Cooling System
- Cable TV Available
Listing and Financial Details
- Assessor Parcel Number 05G01193C
Community Details
Overview
- Association fees include ground maintenance
- Cams Association, Phone Number (919) 587-1862
- Willowbrook Subdivision
- Maintained Community
Recreation
- Golf Course Community
- Tennis Courts
- Community Pool
Map
Home Values in the Area
Average Home Value in this Area
Tax History
| Year | Tax Paid | Tax Assessment Tax Assessment Total Assessment is a certain percentage of the fair market value that is determined by local assessors to be the total taxable value of land and additions on the property. | Land | Improvement |
|---|---|---|---|---|
| 2025 | $2,183 | $343,790 | $65,000 | $278,790 |
| 2024 | $1,729 | $213,410 | $42,500 | $170,910 |
| 2023 | $1,793 | $213,410 | $42,500 | $170,910 |
| 2022 | $1,809 | $213,410 | $42,500 | $170,910 |
| 2021 | $1,809 | $213,410 | $42,500 | $170,910 |
| 2020 | $1,873 | $213,410 | $42,500 | $170,910 |
| 2019 | $1,679 | $191,370 | $42,500 | $148,870 |
| 2018 | $1,614 | $179,800 | $40,000 | $139,800 |
| 2017 | $1,614 | $179,800 | $40,000 | $139,800 |
| 2016 | $1,570 | $178,940 | $40,000 | $138,940 |
| 2015 | $1,570 | $178,940 | $40,000 | $138,940 |
| 2014 | $1,570 | $178,940 | $40,000 | $138,940 |
Property History
| Date | Event | Price | List to Sale | Price per Sq Ft |
|---|---|---|---|---|
| 01/19/2026 01/19/26 | Pending | -- | -- | -- |
| 01/16/2026 01/16/26 | For Sale | $317,900 | 0.0% | $165 / Sq Ft |
| 01/10/2026 01/10/26 | Pending | -- | -- | -- |
| 10/30/2025 10/30/25 | Price Changed | $317,900 | -0.6% | $165 / Sq Ft |
| 10/16/2025 10/16/25 | Price Changed | $319,900 | -1.2% | $166 / Sq Ft |
| 10/09/2025 10/09/25 | Price Changed | $323,900 | -1.2% | $168 / Sq Ft |
| 09/19/2025 09/19/25 | For Sale | $327,900 | -- | $170 / Sq Ft |
Purchase History
| Date | Type | Sale Price | Title Company |
|---|---|---|---|
| Interfamily Deed Transfer | -- | None Available | |
| Warranty Deed | $212,500 | None Available | |
| Warranty Deed | $149,000 | None Available |
Mortgage History
| Date | Status | Loan Amount | Loan Type |
|---|---|---|---|
| Open | $177,400 | New Conventional | |
| Previous Owner | $119,200 | New Conventional |
Source: Doorify MLS
MLS Number: 10122806
APN: 05G01193C
Disclaimer: Certain information contained herein is derived from information provided by parties other than Homes.com. All information provided is deemed reliable, but is not guaranteed to be accurate and should be independently verified.
![]() Some IDX listings have been excluded from this IDX display. Brokers make an effort to deliver accurate information, but buyers should independently verify any information on which they will rely in a transaction. The listing broker shall not be responsible for any typographical errors, misinformation, or misprints, and they shall be held totally harmless from any damages arising from reliance upon this data. This data is provided exclusively for consumers’ personal, non-commercial use. Listings marked with an icon are provided courtesy of the Doorify MLS, Inc. of North Carolina, Internet Data Exchange Database. Closed (sold) listings may have been listed and/or sold by a real estate firm other than the firm(s) featured on this website. Closed data is not available until the sale of the property is recorded in the MLS. Home sale data is not an appraisal, CMA, competitive or comparative market analysis, or home valuation of any property. Copyright 2026 Doorify MLS, Inc. of North Carolina. All rights reserved.
Some IDX listings have been excluded from this IDX display. Brokers make an effort to deliver accurate information, but buyers should independently verify any information on which they will rely in a transaction. The listing broker shall not be responsible for any typographical errors, misinformation, or misprints, and they shall be held totally harmless from any damages arising from reliance upon this data. This data is provided exclusively for consumers’ personal, non-commercial use. Listings marked with an icon are provided courtesy of the Doorify MLS, Inc. of North Carolina, Internet Data Exchange Database. Closed (sold) listings may have been listed and/or sold by a real estate firm other than the firm(s) featured on this website. Closed data is not available until the sale of the property is recorded in the MLS. Home sale data is not an appraisal, CMA, competitive or comparative market analysis, or home valuation of any property. Copyright 2026 Doorify MLS, Inc. of North Carolina. All rights reserved.
- 5305 Oliver Ct
- 3501 Willowtree Ln
- 3405 Oak Trail
- 3420 Oak Trail
- 20 Nicklaus Way
- 3621 Pine Hollow Dr
- 3909 La Varra Dr
- 677 Emerald Bay Cir
- 3720 & 0 E Garner Rd
- 123 Liam St
- 103 Liam St Unit 108
- 957 Jasper Mine Trail
- 55 Pink Iris Ct
- 669 Emerald Bay Cir
- 108 Tombolo Way
- 151 Marywood Dr
- 175 Canyon Gap Way
- 612 Cedar Hollow Way
- 25 Cloudberry Ct
- 141 Railcar Way

Ask me questions while you tour the home.