3605 38th St W Mapleton, ND 58059
Estimated Value: $634,545 - $787,000
3
Beds
2
Baths
2,182
Sq Ft
$326/Sq Ft
Est. Value
About This Home
This home is located at 3605 38th St W, Mapleton, ND 58059 and is currently estimated at $710,773, approximately $325 per square foot. 3605 38th St W is a home located in Cass County with nearby schools including Aurora Elementary School, Liberty Middle School, and West Fargo Sheyenne High School.
Ownership History
Date
Name
Owned For
Owner Type
Purchase Details
Closed on
Jun 2, 2017
Sold by
Campbell Brothers Construction Inc
Bought by
Ockert Rory A and Ockert Tanya L
Current Estimated Value
Home Financials for this Owner
Home Financials are based on the most recent Mortgage that was taken out on this home.
Original Mortgage
$369,000
Outstanding Balance
$301,592
Interest Rate
3.75%
Mortgage Type
Adjustable Rate Mortgage/ARM
Estimated Equity
$409,181
Purchase Details
Closed on
Feb 10, 2016
Sold by
Bank Of America Na
Bought by
Campbell Brothers Construction Inc
Purchase Details
Closed on
Nov 19, 2014
Sold by
Quam Sara and Quam Marty
Bought by
Bank Of America Na
Purchase Details
Closed on
Sep 6, 2005
Sold by
Federal Home Loan Mortgage Corporation
Bought by
Quam Marty and Quam Sara
Home Financials for this Owner
Home Financials are based on the most recent Mortgage that was taken out on this home.
Original Mortgage
$34,205
Interest Rate
5.8%
Mortgage Type
Purchase Money Mortgage
Purchase Details
Closed on
Jun 21, 2005
Sold by
Carlisle Bruce D and Carlisle Lynn
Bought by
Bank Of America N A
Create a Home Valuation Report for This Property
The Home Valuation Report is an in-depth analysis detailing your home's value as well as a comparison with similar homes in the area
Purchase History
| Date | Buyer | Sale Price | Title Company |
|---|---|---|---|
| Ockert Rory A | $410,000 | None Available | |
| Campbell Brothers Construction Inc | $174,900 | Fm Title | |
| Bank Of America Na | $208,000 | None Available | |
| Quam Marty | -- | -- | |
| Bank Of America N A | $47,500 | -- |
Source: Public Records
Mortgage History
| Date | Status | Borrower | Loan Amount |
|---|---|---|---|
| Open | Ockert Rory A | $369,000 | |
| Previous Owner | Quam Marty | $34,205 |
Source: Public Records
Tax History
| Year | Tax Paid | Tax Assessment Tax Assessment Total Assessment is a certain percentage of the fair market value that is determined by local assessors to be the total taxable value of land and additions on the property. | Land | Improvement |
|---|---|---|---|---|
| 2024 | $5,304 | $322,200 | $37,500 | $284,700 |
| 2023 | $5,686 | $315,700 | $37,500 | $278,200 |
| 2022 | $5,435 | $288,500 | $37,500 | $251,000 |
| 2021 | $5,177 | $264,900 | $37,500 | $227,400 |
| 2020 | $3,905 | $202,850 | $26,800 | $176,050 |
| 2019 | $3,890 | $202,850 | $26,800 | $176,050 |
| 2018 | $3,729 | $198,800 | $26,250 | $172,550 |
| 2017 | $3,429 | $189,300 | $25,000 | $164,300 |
| 2016 | $2,866 | $168,000 | $20,000 | $148,000 |
| 2015 | $3,031 | $168,000 | $20,000 | $148,000 |
| 2014 | $3,177 | $168,000 | $20,000 | $148,000 |
| 2013 | $3,181 | $168,000 | $20,000 | $148,000 |
Source: Public Records
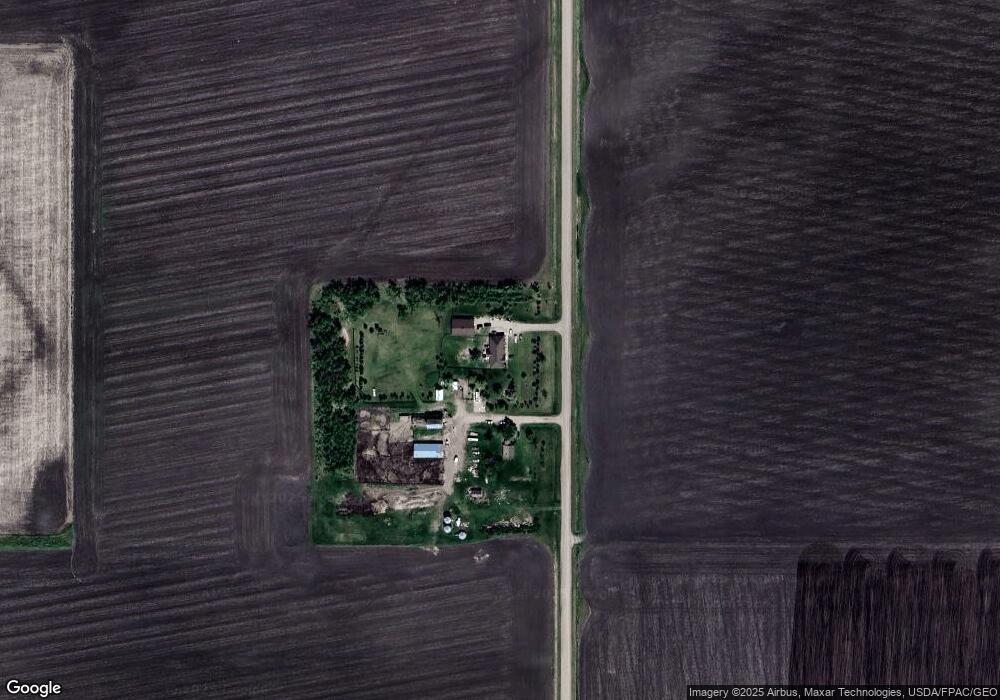
Map
Nearby Homes
- 1236 S Beach Way
- 1381 Westport Beach Way
- 1037 39th Ave W
- 1119 29th Ave W
- 1234 27th Ave W
- 1158 44th Ave W
- 2240 14th St W
- 975 30th Ave W
- 989 39th Ave W
- 962 31st Ave W
- 963 30th Ave W
- 2750 10th St W
- 1101 Aspen Terrace
- 4741 11th St W
- 954 28th Ave W
- 939 Eaglewood Ave
- 4757 11th St W
- 922 31st Ave W
- 952 38 1 2 Ave W
- 4717 11th St W
Your Personal Tour Guide
Ask me questions while you tour the home.