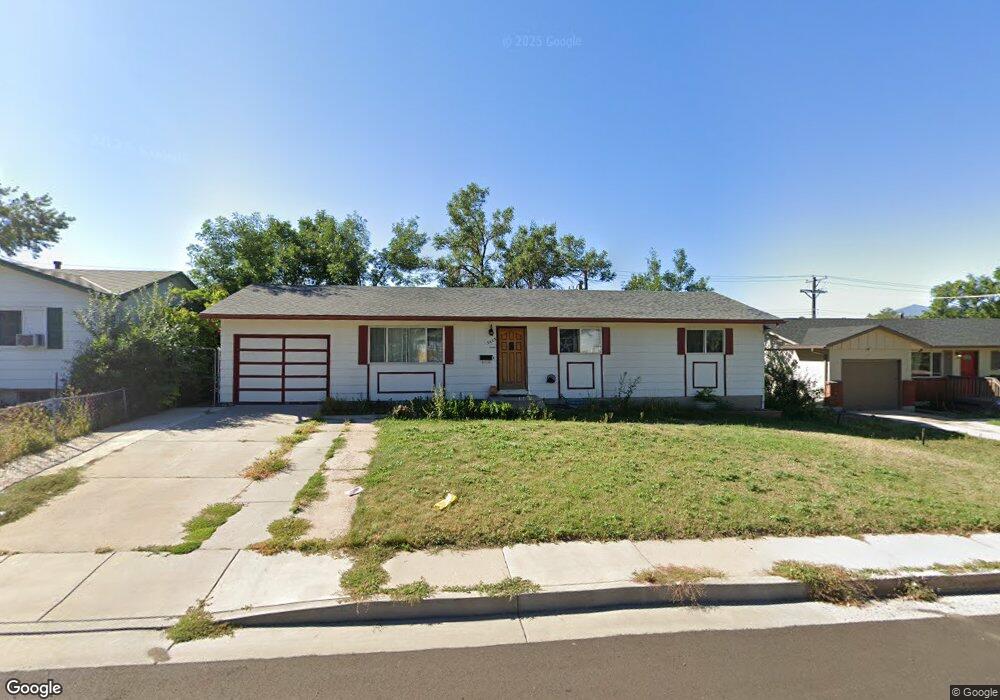
3605 Indianpipe Cir Colorado Springs, CO 80918
Garden Ranch NeighborhoodEstimated Value: $351,959 - $401,000
2
Beds
2
Baths
1,128
Sq Ft
$341/Sq Ft
Est. Value
About This Home
This home is located at 3605 Indianpipe Cir, Colorado Springs, CO 80918 and is currently estimated at $384,490, approximately $340 per square foot. 3605 Indianpipe Cir is a home located in El Paso County with nearby schools including Grant Elementary School, Mann Middle School, and Mitchell High School.
Ownership History
Date
Name
Owned For
Owner Type
Purchase Details
Closed on
Jan 5, 2007
Sold by
Carnevale Angela M and Wojcik Michael E
Bought by
Carnevale Angela M
Current Estimated Value
Purchase Details
Closed on
Dec 29, 2004
Sold by
Guevara Jerry C and Guevara Louise M
Bought by
Carnevale Angela M and Wojcik Michael E
Home Financials for this Owner
Home Financials are based on the most recent Mortgage that was taken out on this home.
Original Mortgage
$127,920
Outstanding Balance
$67,214
Interest Rate
6.37%
Mortgage Type
Unknown
Estimated Equity
$317,276
Purchase Details
Closed on
Aug 12, 1994
Sold by
Guevara Carlos W and Guevara Louise M
Bought by
Guevara Jerry C and Guevara Louise M
Home Financials for this Owner
Home Financials are based on the most recent Mortgage that was taken out on this home.
Original Mortgage
$62,565
Interest Rate
8.69%
Purchase Details
Closed on
May 1, 1977
Bought by
Carnevale Angela M
Create a Home Valuation Report for This Property
The Home Valuation Report is an in-depth analysis detailing your home's value as well as a comparison with similar homes in the area
Home Values in the Area
Average Home Value in this Area
Purchase History
| Date | Buyer | Sale Price | Title Company |
|---|---|---|---|
| Carnevale Angela M | -- | None Available | |
| Carnevale Angela M | $159,900 | Metropolitan Title Agency | |
| Guevara Jerry C | -- | Unified Title Co Inc | |
| Carnevale Angela M | -- | -- |
Source: Public Records
Mortgage History
| Date | Status | Borrower | Loan Amount |
|---|---|---|---|
| Open | Carnevale Angela M | $127,920 | |
| Previous Owner | Guevara Jerry C | $62,565 | |
| Closed | Carnevale Angela M | $31,980 |
Source: Public Records
Tax History Compared to Growth
Tax History
| Year | Tax Paid | Tax Assessment Tax Assessment Total Assessment is a certain percentage of the fair market value that is determined by local assessors to be the total taxable value of land and additions on the property. | Land | Improvement |
|---|---|---|---|---|
| 2025 | $1,322 | $28,970 | -- | -- |
| 2024 | $1,209 | $28,200 | $4,340 | $23,860 |
| 2022 | $1,101 | $19,670 | $3,250 | $16,420 |
| 2021 | $1,194 | $20,240 | $3,350 | $16,890 |
| 2020 | $1,105 | $16,280 | $2,900 | $13,380 |
| 2019 | $1,099 | $16,280 | $2,900 | $13,380 |
| 2018 | $925 | $12,600 | $1,940 | $10,660 |
| 2017 | $876 | $12,600 | $1,940 | $10,660 |
| 2016 | $717 | $12,360 | $2,010 | $10,350 |
| 2015 | $714 | $12,360 | $2,010 | $10,350 |
| 2014 | $670 | $11,140 | $2,010 | $9,130 |
Source: Public Records
Map
Nearby Homes
- 3633 Indianpipe Cir
- 3010 Fireweed Dr
- 3704 Indianpipe Cir
- 4016 Goldenrod Dr
- 3916 Coral Point
- 3709 Anemone Cir
- 3710 Windflower Cir
- 3716 Indianpipe Cir
- 3619 Queen Anne Way
- 2727 Flintridge Dr
- 3548 Queen Anne Way
- 3643 Queen Anne Way
- 3680 E Wade Ln
- 3515 Queen Anne Way
- 3618 Queen Anne Way
- 3509 Queen Anne Way
- 3660 E Wade Ln
- 3342 Queen Anne Way
- 4410 Moonlight Dr
- 3457 Queen Anne Way
- 3603 Indianpipe Cir
- 3607 Indianpipe Cir
- 3609 Indianpipe Cir
- 3601 Indianpipe Cir
- 3600 Windflower Cir
- 3601 Meadowland Blvd
- 3611 Indianpipe Cir
- 3608 Indianpipe Cir
- 3602 Windflower Cir
- 3603 Meadowland Blvd
- 3603 Windflower Cir
- 3604 Windflower Cir
- 3605 Meadowland Blvd
- 3613 Indianpipe Cir
- 3600 Anemone Cir
- 3605 Windflower Cir
- 3530 Meadowland Blvd
- 3528 Indianpipe Cir
- 3607 Meadowland Blvd
- 3606 Windflower Cir