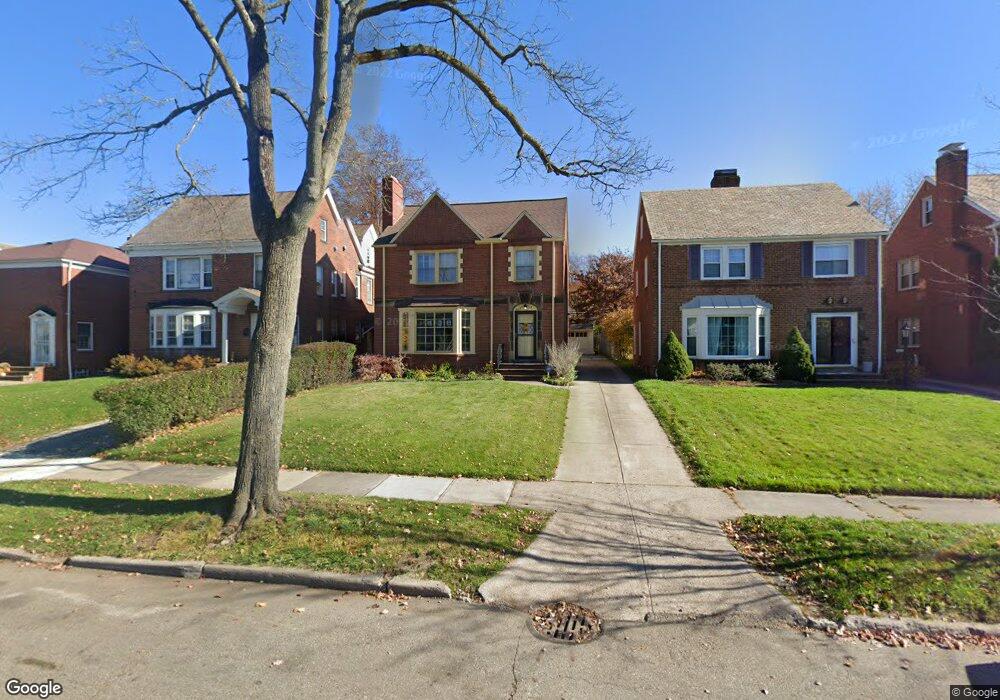
3605 Ingleside Rd Shaker Heights, OH 44122
Estimated Value: $266,000 - $303,036
4
Beds
3
Baths
2,090
Sq Ft
$139/Sq Ft
Est. Value
About This Home
This home is located at 3605 Ingleside Rd, Shaker Heights, OH 44122 and is currently estimated at $290,759, approximately $139 per square foot. 3605 Ingleside Rd is a home located in Cuyahoga County with nearby schools including Lomond Elementary School, Woodbury Elementary School, and Shaker Heights Middle School.
Ownership History
Date
Name
Owned For
Owner Type
Purchase Details
Closed on
Jun 19, 1998
Sold by
Gladden Dean R and Gladden Jane T
Bought by
Nielsen Craig D and Nielsen Simone
Current Estimated Value
Home Financials for this Owner
Home Financials are based on the most recent Mortgage that was taken out on this home.
Original Mortgage
$118,400
Outstanding Balance
$23,584
Interest Rate
7%
Estimated Equity
$267,176
Purchase Details
Closed on
Mar 14, 1983
Sold by
Parry Richard D
Bought by
Gladden Dean R and Gladden Jane T
Purchase Details
Closed on
Nov 26, 1980
Sold by
Marshall Robert J
Bought by
Parry Richard D
Purchase Details
Closed on
Apr 11, 1979
Sold by
Caluducan Saturnino A
Bought by
Marshall Robert J
Purchase Details
Closed on
Jan 13, 1978
Sold by
Schecter Sheldon D and Schecter Renee L
Bought by
Caluducan Saturnino A
Purchase Details
Closed on
Jan 1, 1975
Bought by
Schecter Sheldon D and Schecter Renee L
Create a Home Valuation Report for This Property
The Home Valuation Report is an in-depth analysis detailing your home's value as well as a comparison with similar homes in the area
Home Values in the Area
Average Home Value in this Area
Purchase History
| Date | Buyer | Sale Price | Title Company |
|---|---|---|---|
| Nielsen Craig D | $151,000 | Title Xperts Agency Inc | |
| Gladden Dean R | $81,500 | -- | |
| Parry Richard D | $77,000 | -- | |
| Marshall Robert J | $71,500 | -- | |
| Caluducan Saturnino A | $62,000 | -- | |
| Schecter Sheldon D | -- | -- |
Source: Public Records
Mortgage History
| Date | Status | Borrower | Loan Amount |
|---|---|---|---|
| Open | Nielsen Craig D | $118,400 | |
| Closed | Nielsen Craig D | $29,600 |
Source: Public Records
Tax History Compared to Growth
Tax History
| Year | Tax Paid | Tax Assessment Tax Assessment Total Assessment is a certain percentage of the fair market value that is determined by local assessors to be the total taxable value of land and additions on the property. | Land | Improvement |
|---|---|---|---|---|
| 2024 | $7,540 | $84,490 | $14,840 | $69,650 |
| 2023 | $7,037 | $62,480 | $11,130 | $51,350 |
| 2022 | $6,836 | $178,500 | $31,800 | $146,700 |
| 2021 | $6,813 | $62,480 | $11,130 | $51,350 |
| 2020 | $6,587 | $56,810 | $10,120 | $46,690 |
| 2019 | $6,493 | $162,300 | $28,900 | $133,400 |
| 2018 | $6,303 | $56,810 | $10,120 | $46,690 |
| 2017 | $6,338 | $52,430 | $8,750 | $43,680 |
| 2016 | $6,085 | $52,430 | $8,750 | $43,680 |
| 2015 | $6,187 | $52,430 | $8,750 | $43,680 |
| 2014 | $6,187 | $51,420 | $8,580 | $42,840 |
Source: Public Records
Map
Nearby Homes
- 3553 Ingleside Rd
- 3633 Ingleside Rd
- 3533 Daleford Rd
- 17422 Lomond Blvd
- 3658 Normandy Rd
- 17718 Lomond Blvd
- 18112 Chagrin Blvd
- 3638 Glencairn Rd
- 18019 Chagrin Blvd
- 18112 Lomond Blvd
- 3698 Strandhill Rd
- 3575 Gridley Rd
- 3690 Daleford Rd
- 3710 Strandhill Rd
- 18413 Newell Rd
- 3702 Daleford Rd
- 17725 Scottsdale Blvd
- 17429 Scottsdale Blvd
- 18431 Newell Rd
- 18416 Winslow Rd
- 3601 Ingleside Rd
- 3613 Ingleside Rd
- 3597 Ingleside Rd
- 3617 Ingleside Rd
- 3593 Ingleside Rd
- 3608 Palmerston Rd
- 3614 Palmerston Rd
- 3604 Palmerston Rd
- 3621 Ingleside Rd
- 3591 Ingleside Rd
- 3618 Palmerston Rd
- 3598 Palmerston Rd
- 3604 Ingleside Rd
- 3600 Ingleside Rd
- 3620 Palmerston Rd
- 3625 Ingleside Rd
- 3625 Ingleside Rd Unit 1
- 3625 Ingleside Rd Unit 2
- 3612 Ingleside Rd
- 3585 Ingleside Rd